Agent Performance
The Agent Performance page lets you monitor and compare the quality of every agent in your project across all evaluation dimensions. It surfaces which agents are performing well, which need attention, and how quality trends over time — useful for multi-agent architectures where different agents handle different conversation types. Navigation: Project → Insights → Agent Performance Date range selector: Use the toggle in the top-right corner to select 7d, 30d, or 90d. A Compare button next to the date selector opens a side-by-side agent comparison view.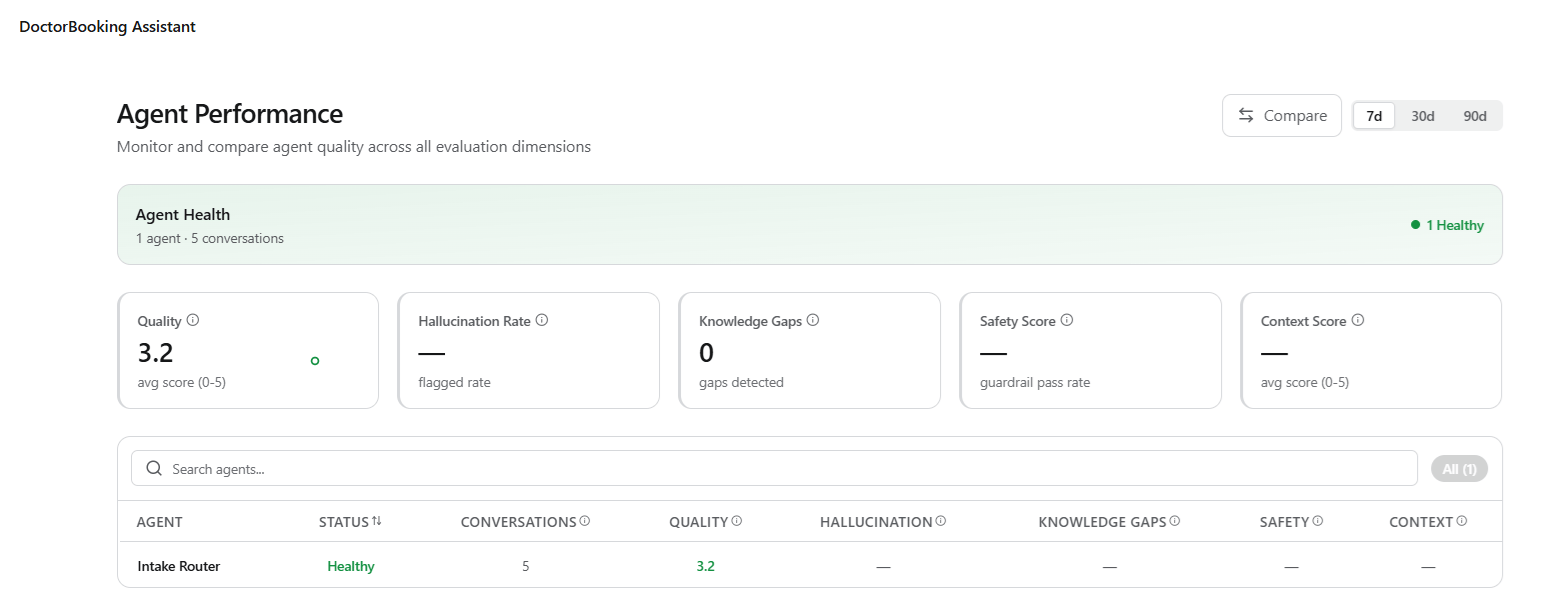
Agent Health Summary
A banner at the top of the page displays the total number of agents, total conversations evaluated, and a status breakdown showing how many agents the system flags as Critical (red) versus Healthy (green). This gives you an instant read on overall agent health before diving into individual scores.KPI Metric Cards
Five metric cards show aggregated scores across all agents:Agent Table
Below the KPI cards, a searchable, sortable table lists every agent with the following columns:
Use the search bar to filter by agent name. Toggle between Critical and All using the filter pills to focus on agents needing immediate attention.
Quality Trend Chart
A time-series chart at the bottom of the page plots two lines, Avg Quality and Flagged, over the selected period. The shaded area between the lines highlights the quality gap, making regressions visually obvious. Hover over any point to see exact values and dates.This page requires analytics pipelines. Enable pipelines in Settings to start tracking agent quality, hallucination rates, knowledge gaps, and more. Without active pipelines, the page displays a placeholder.
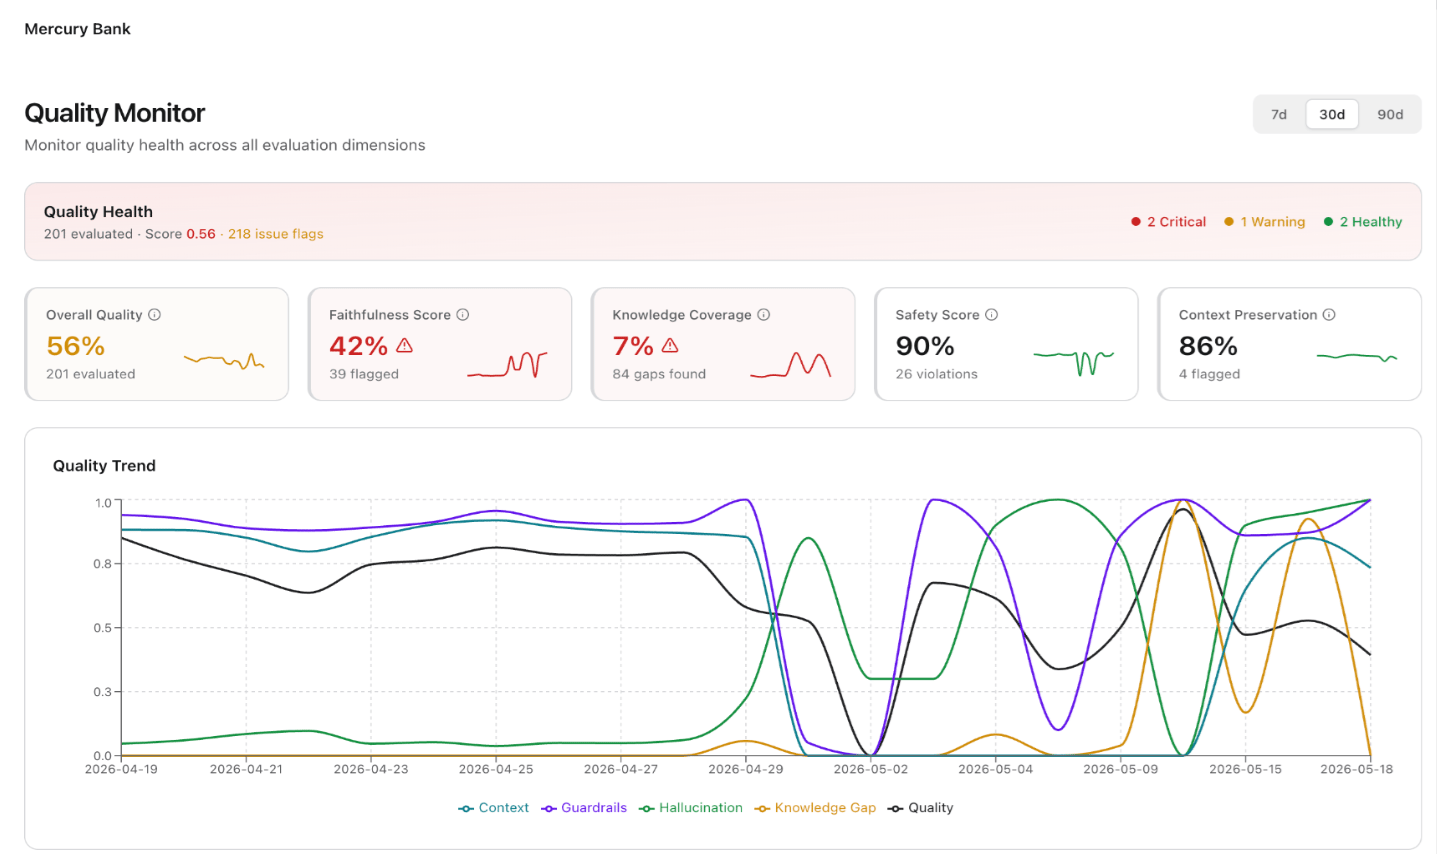
Quality Monitor
The Quality Monitor page provides a centralized health check across all evaluation dimensions. Use it to assess how quality is trending and which dimensions need attention. It aggregates outputs from multiple pipelines into a unified scoring view with trend analysis, dimension-level drill-downs, and issue flagging. Navigation: Project → Insights → Quality Monitor Date range selector: Use the toggle to select 7d, 30d, or 90d.