

Overview
Analytics provides a history of all administrative tasks through two views: the Dashboard view and the Data view. Switch between them using the toggle at the top right of the Analytics page. The views display key performance metrics, trends, and reports, enabling you to gauge real-time usage and performance.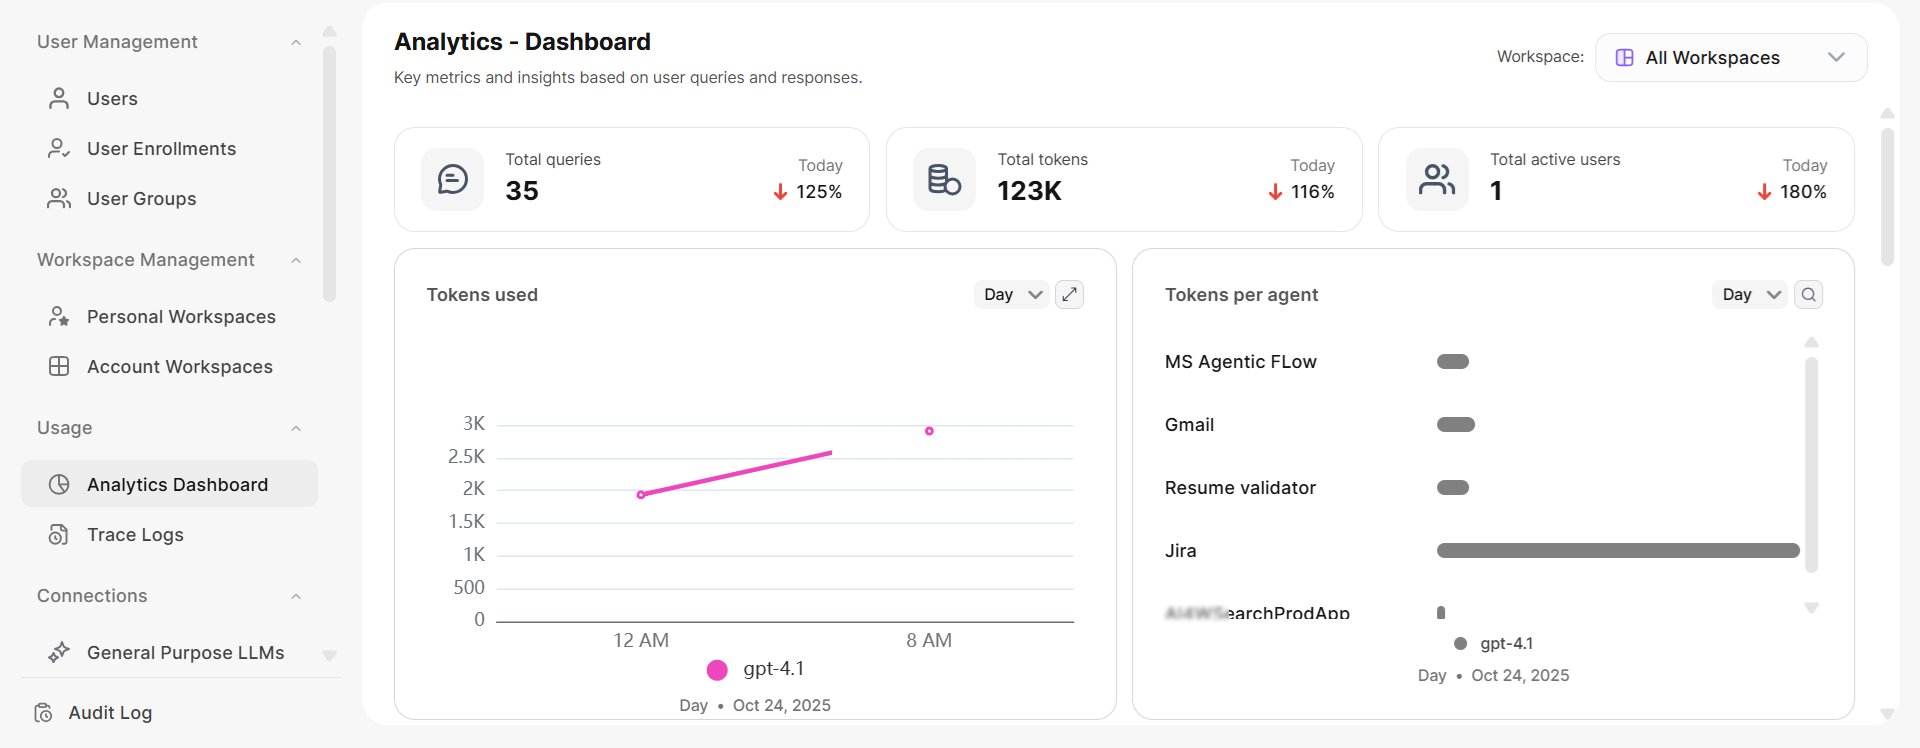
Dashboard View
The Dashboard view provides graphical reports on usage, performance, and feedback. At the top, you can see the total queries, total tokens, and total active users for the day.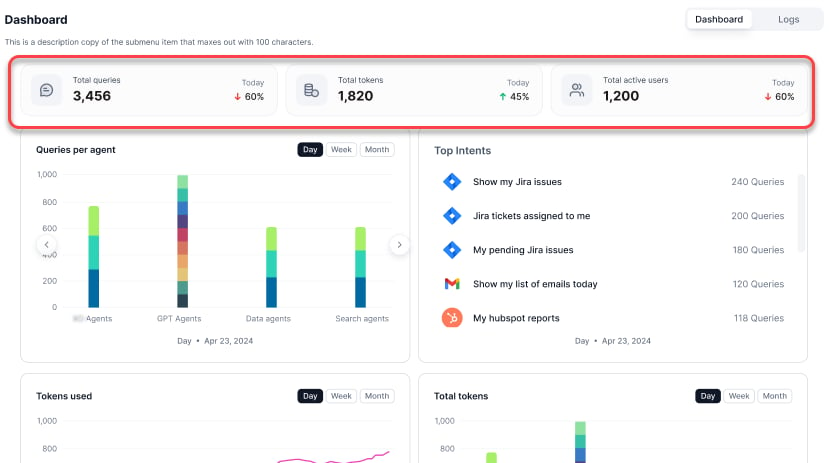
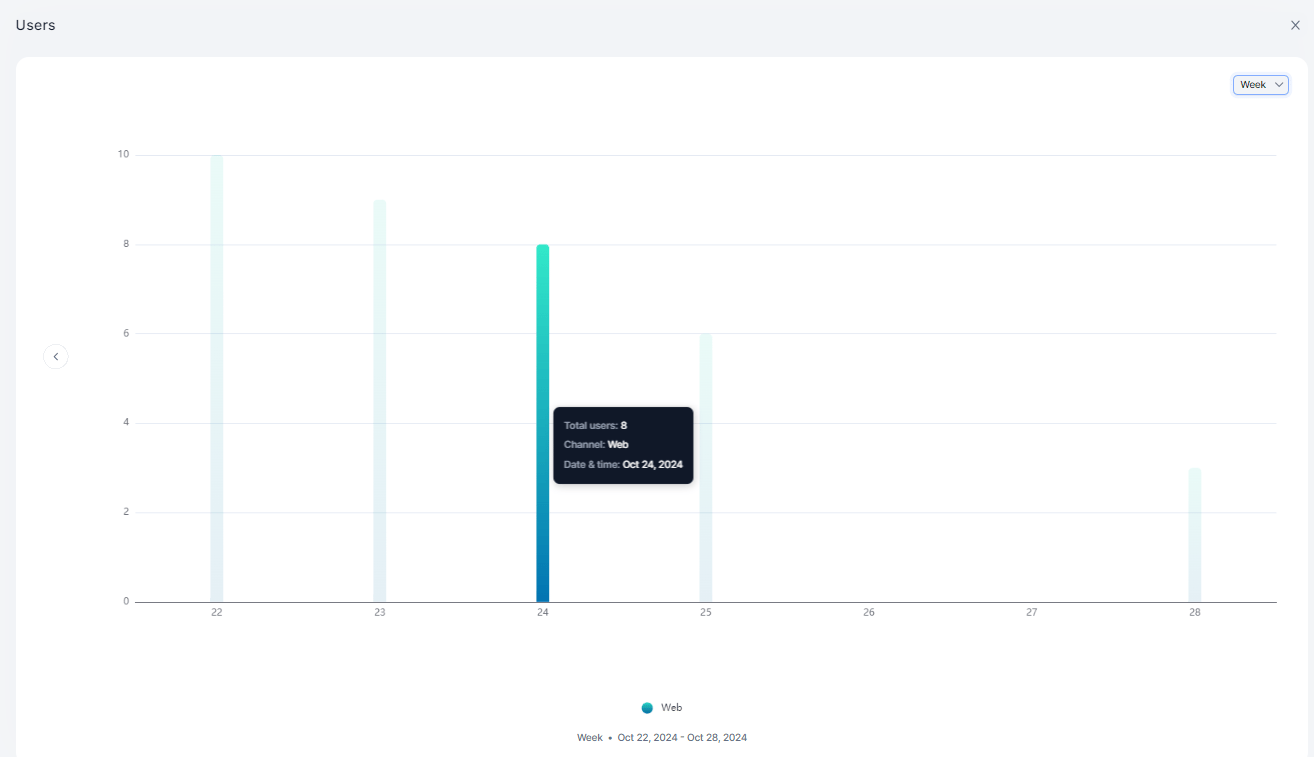
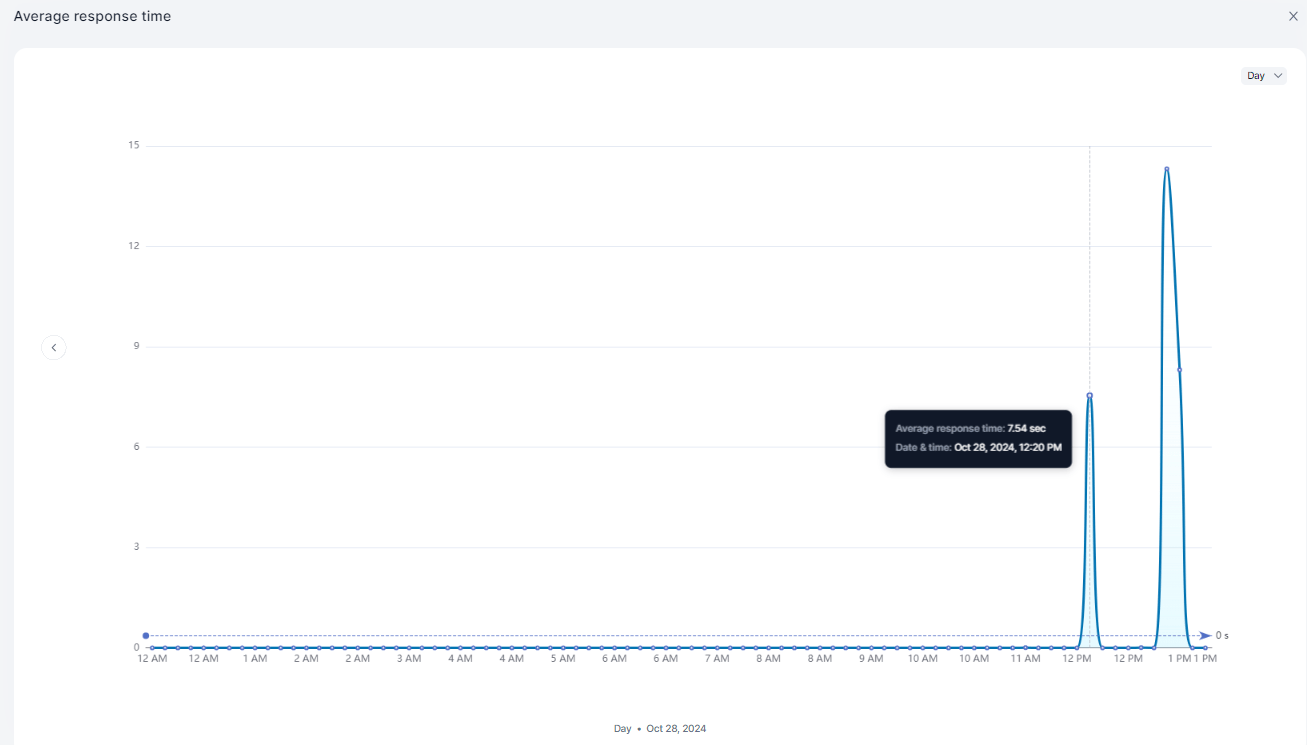
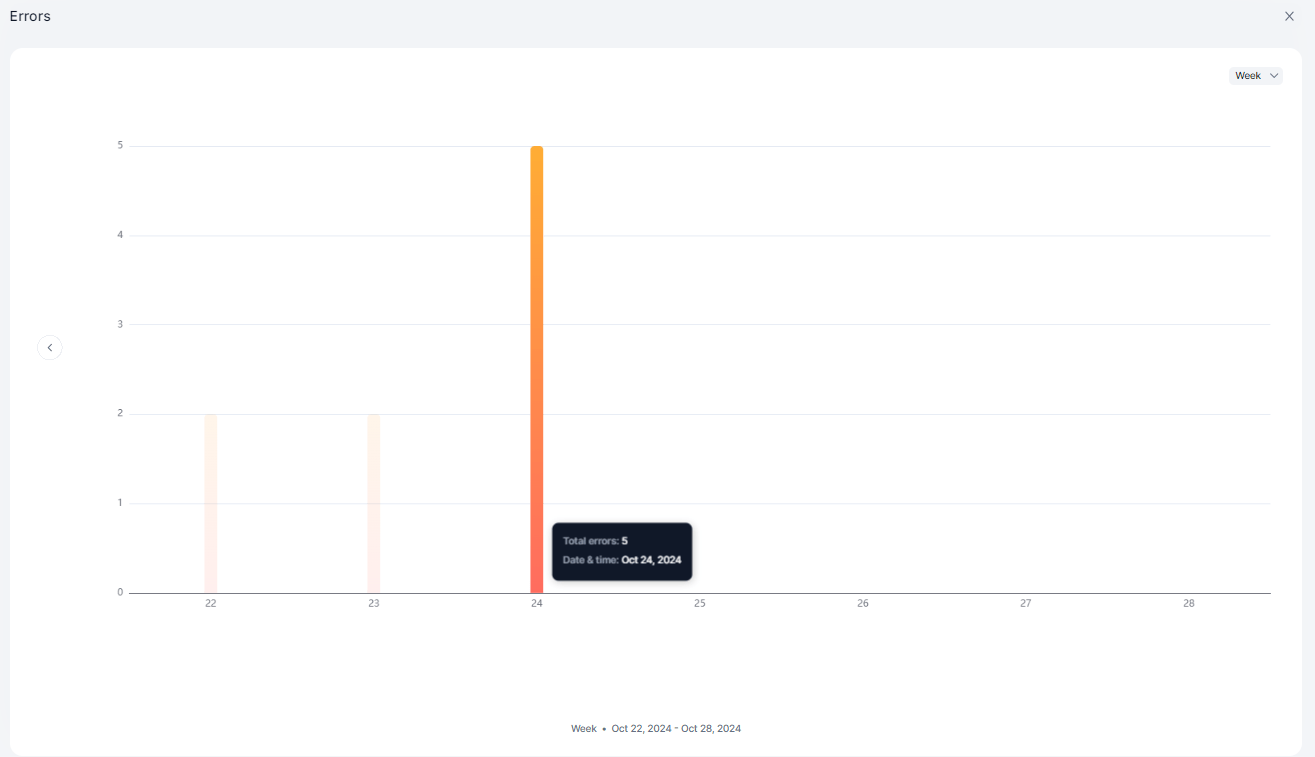
All graphical reports support Day, Week, and Month views with left-right navigation for detailed metrics at each time point. Time averaging: 30-minute average (daily), 6-hour average (weekly), daily average (monthly).
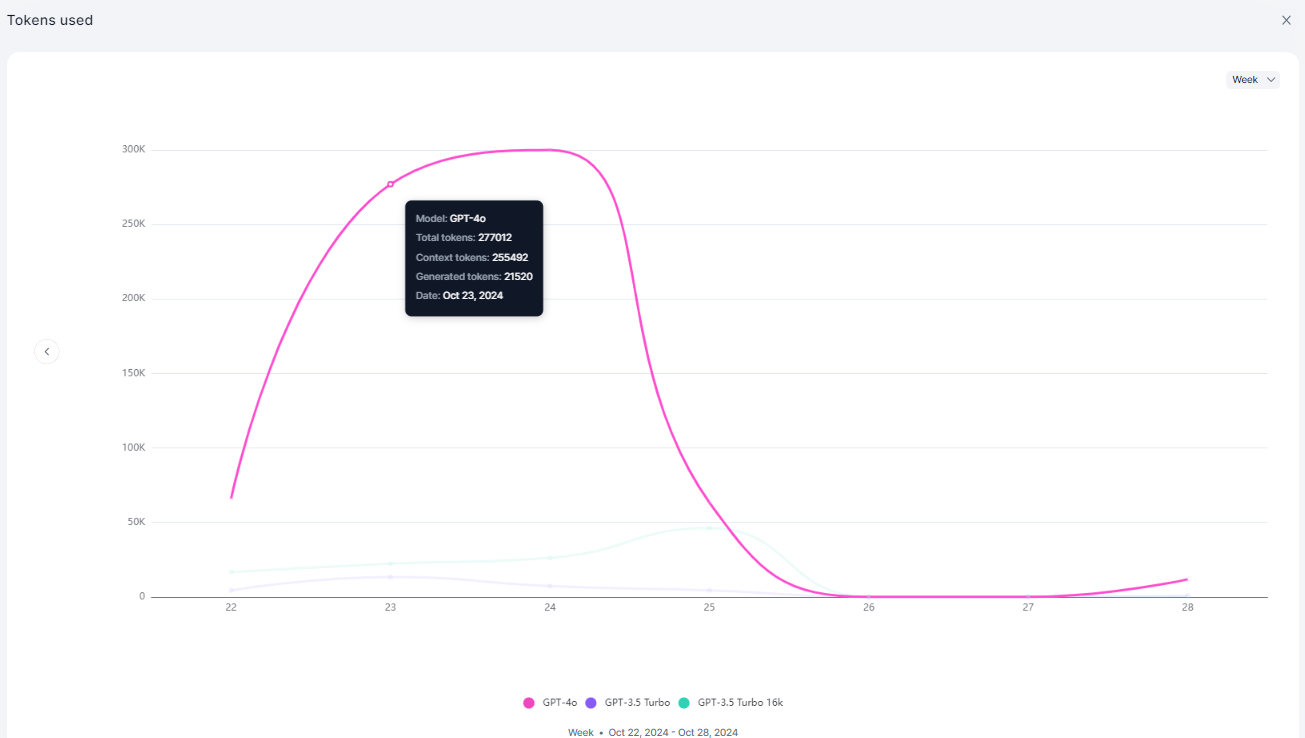
Tokens Used
Displays token usage trends across models.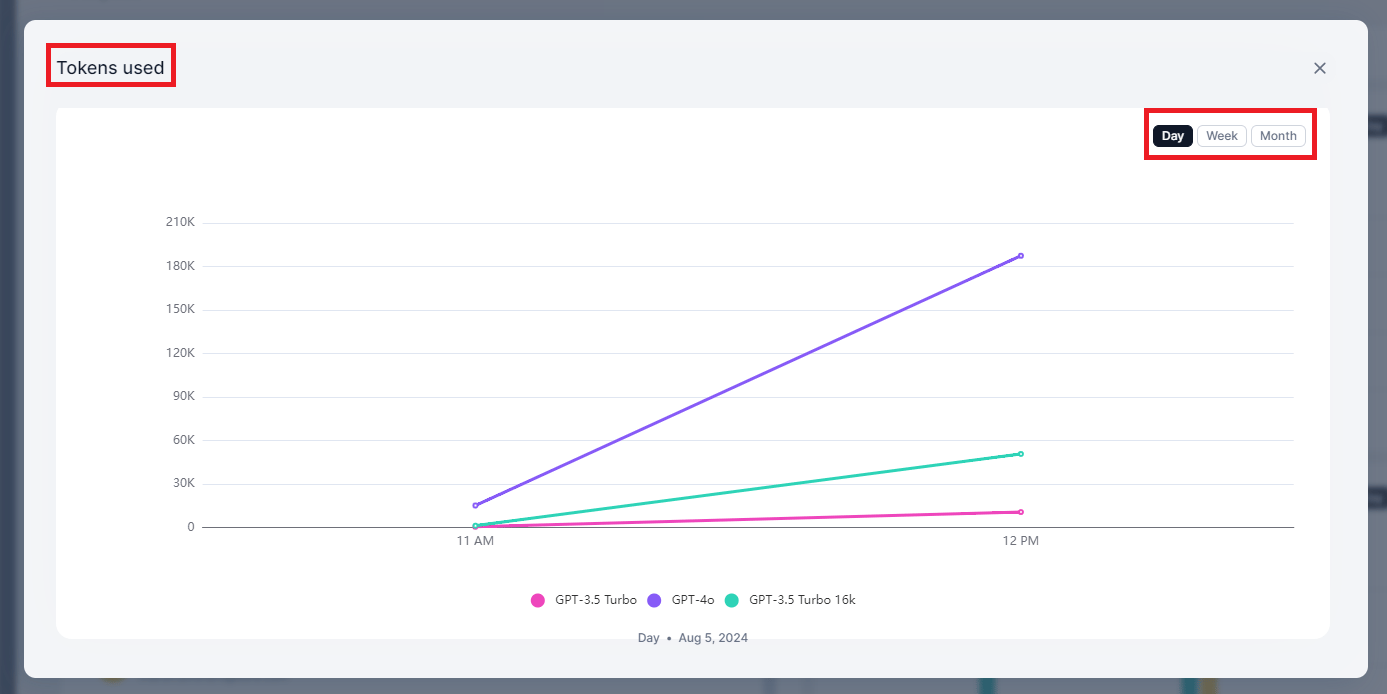
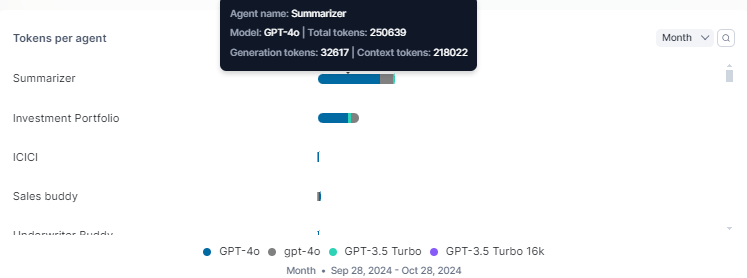
Tokens Per Agent
Displays token consumption broken down by agent.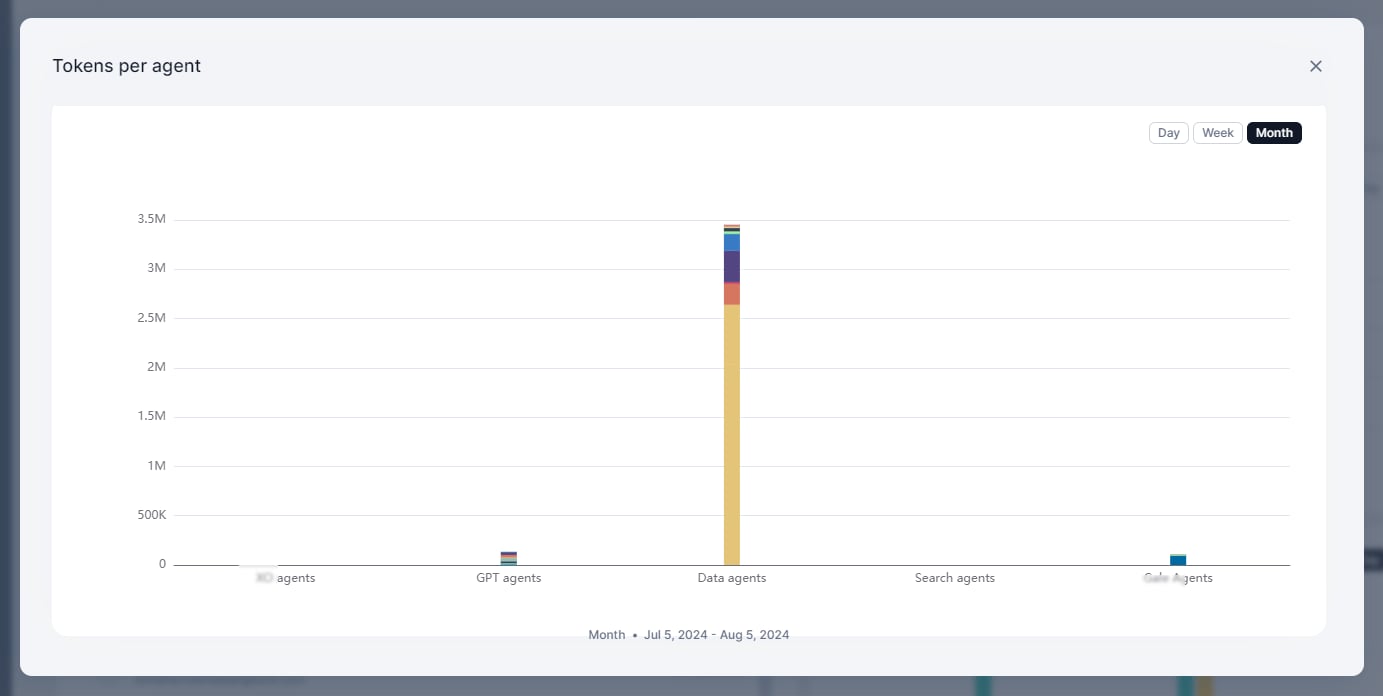
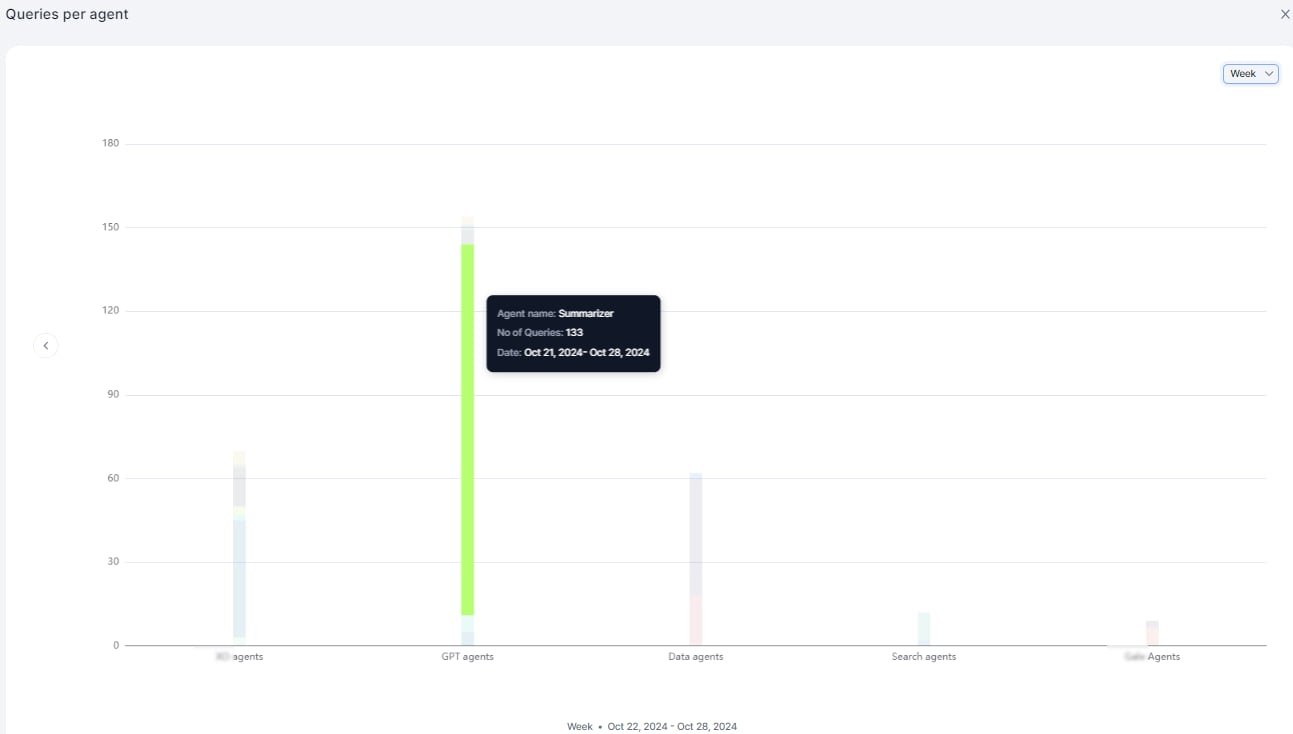
Queries Per Agent
Displays query volume by agent, categorized by agent type: AI for Service, GPT, Data, Search, and Workflow.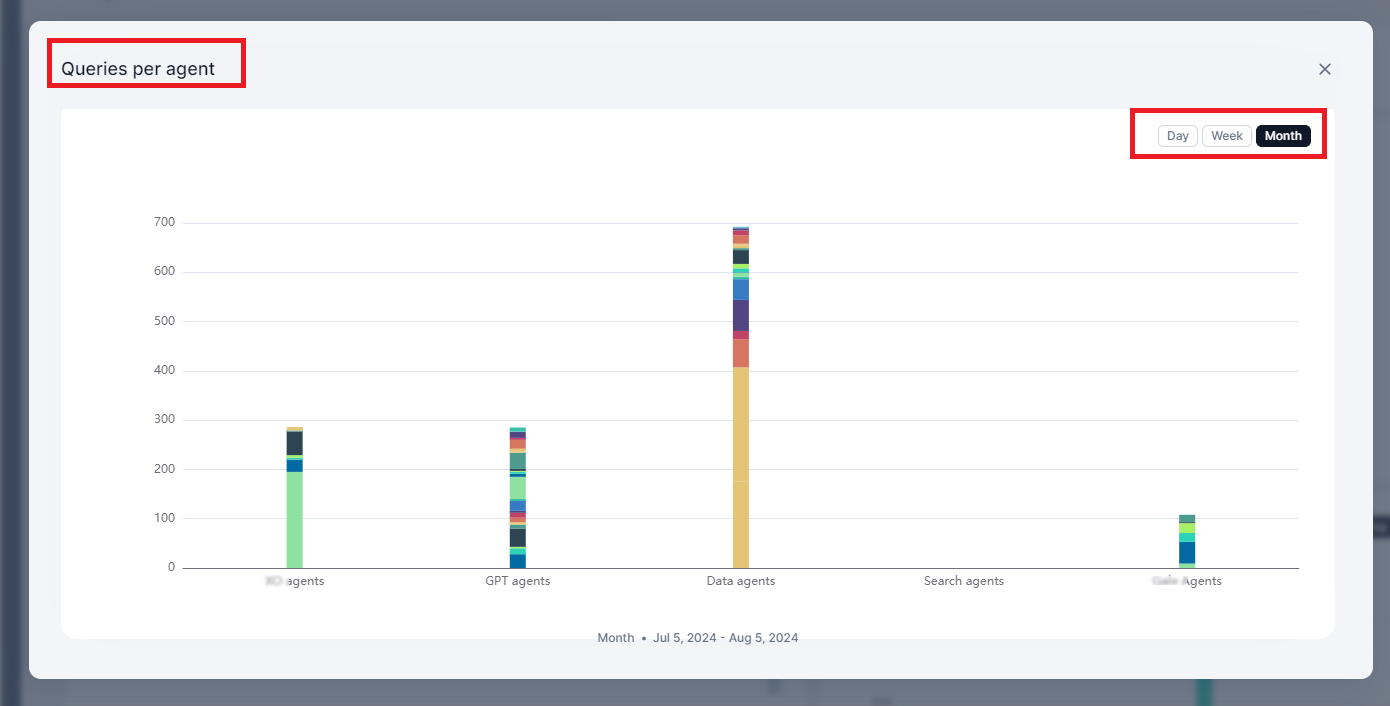
Top Agents
Displays agents ranked by query volume in descending order.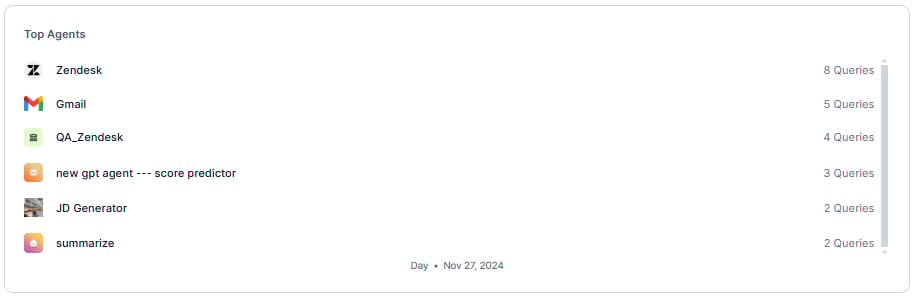
Top Users
Displays the top 10 users by query count.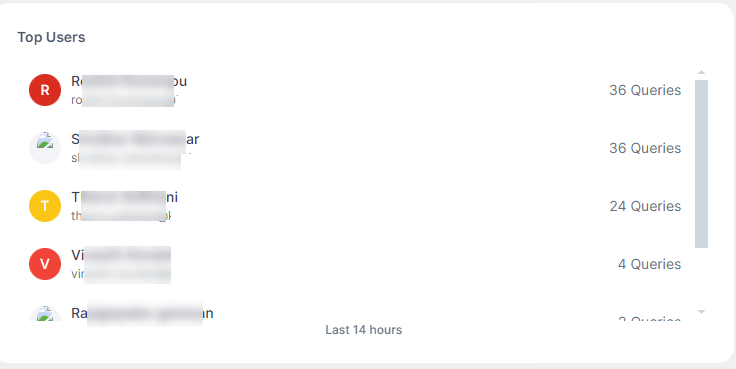
Users
Displays unique users interacting with the system, comparing web vs. native platforms.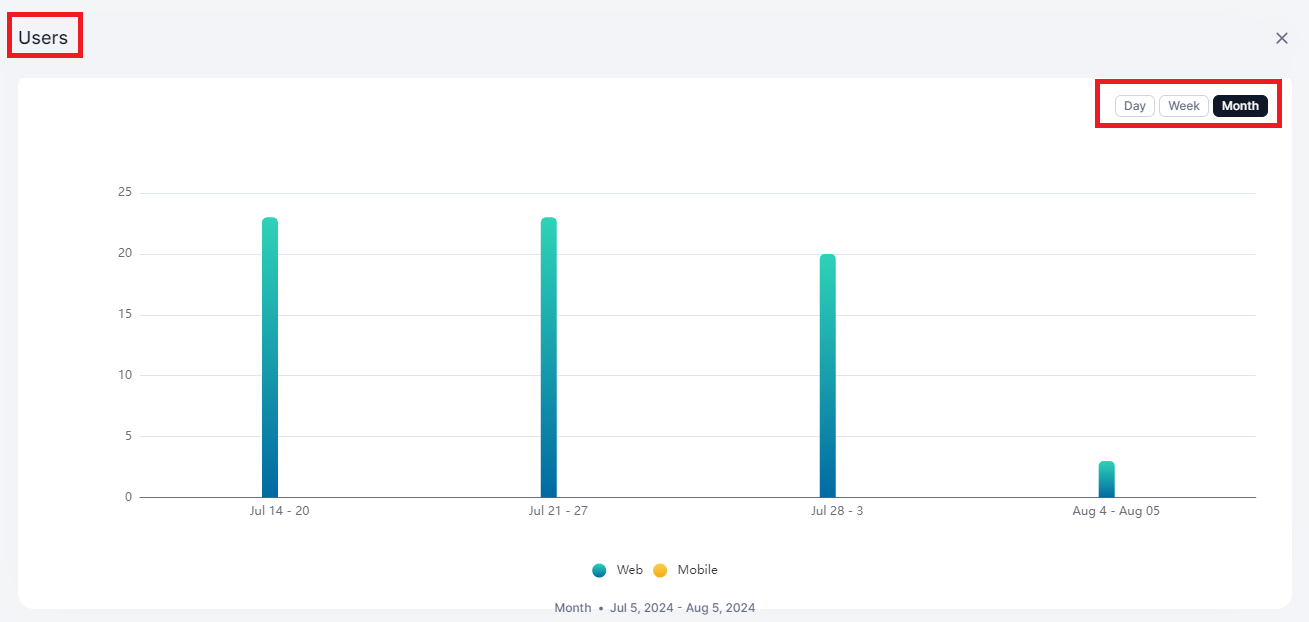
Average Response Time
Displays the average response time of the service over time.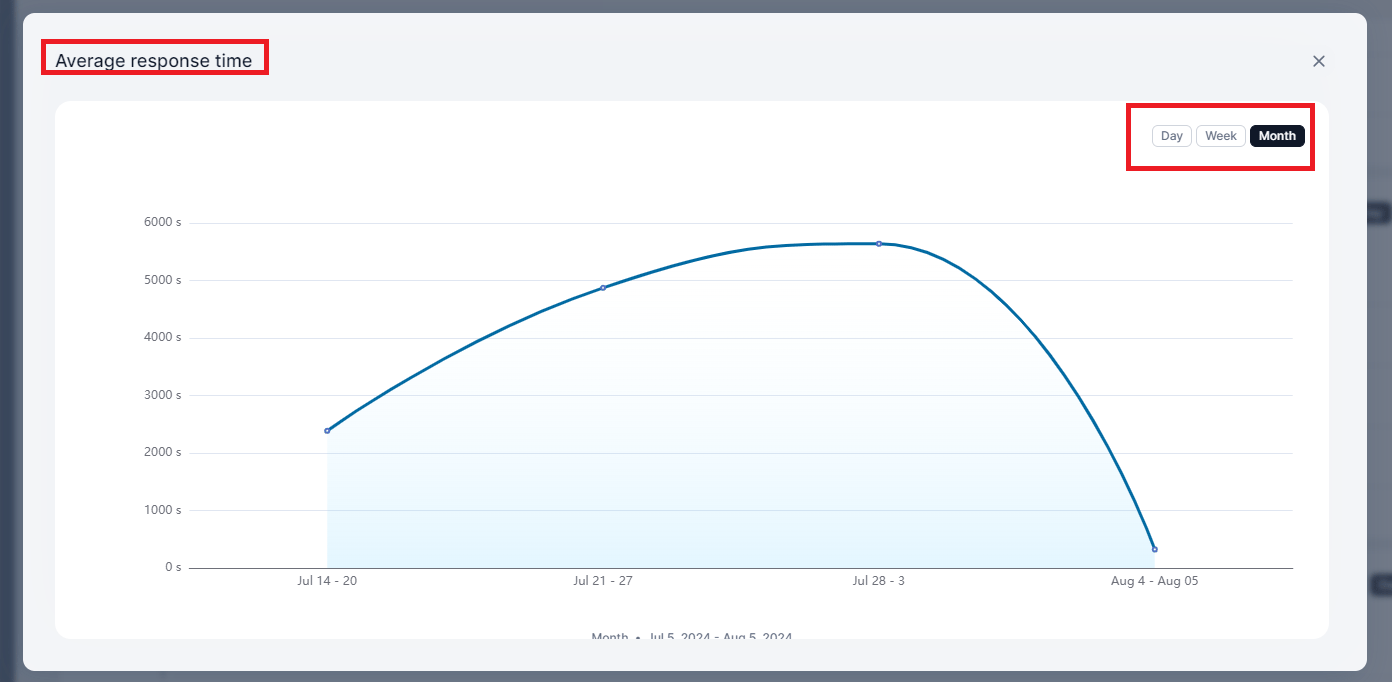
Errors
Displays the number of queries that resulted in errors over time.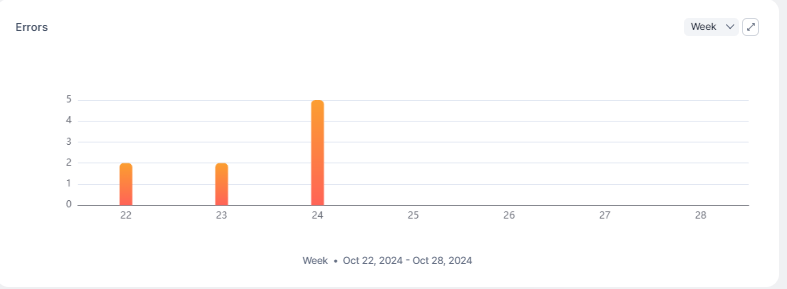
Feedback
Displays end-user feedback on responses.
Trace Logs
The Trace logs lists individual query records. Each record corresponds to a user utterance.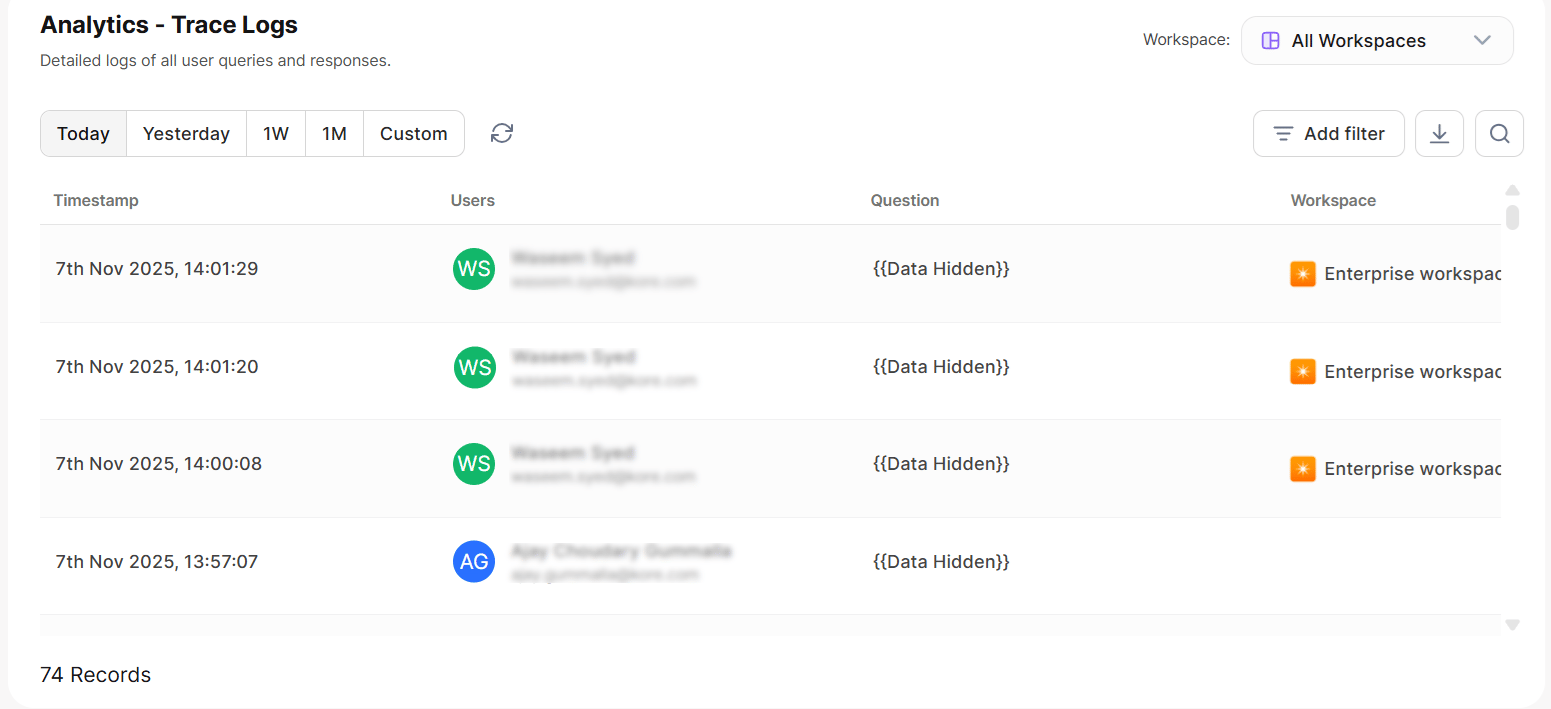
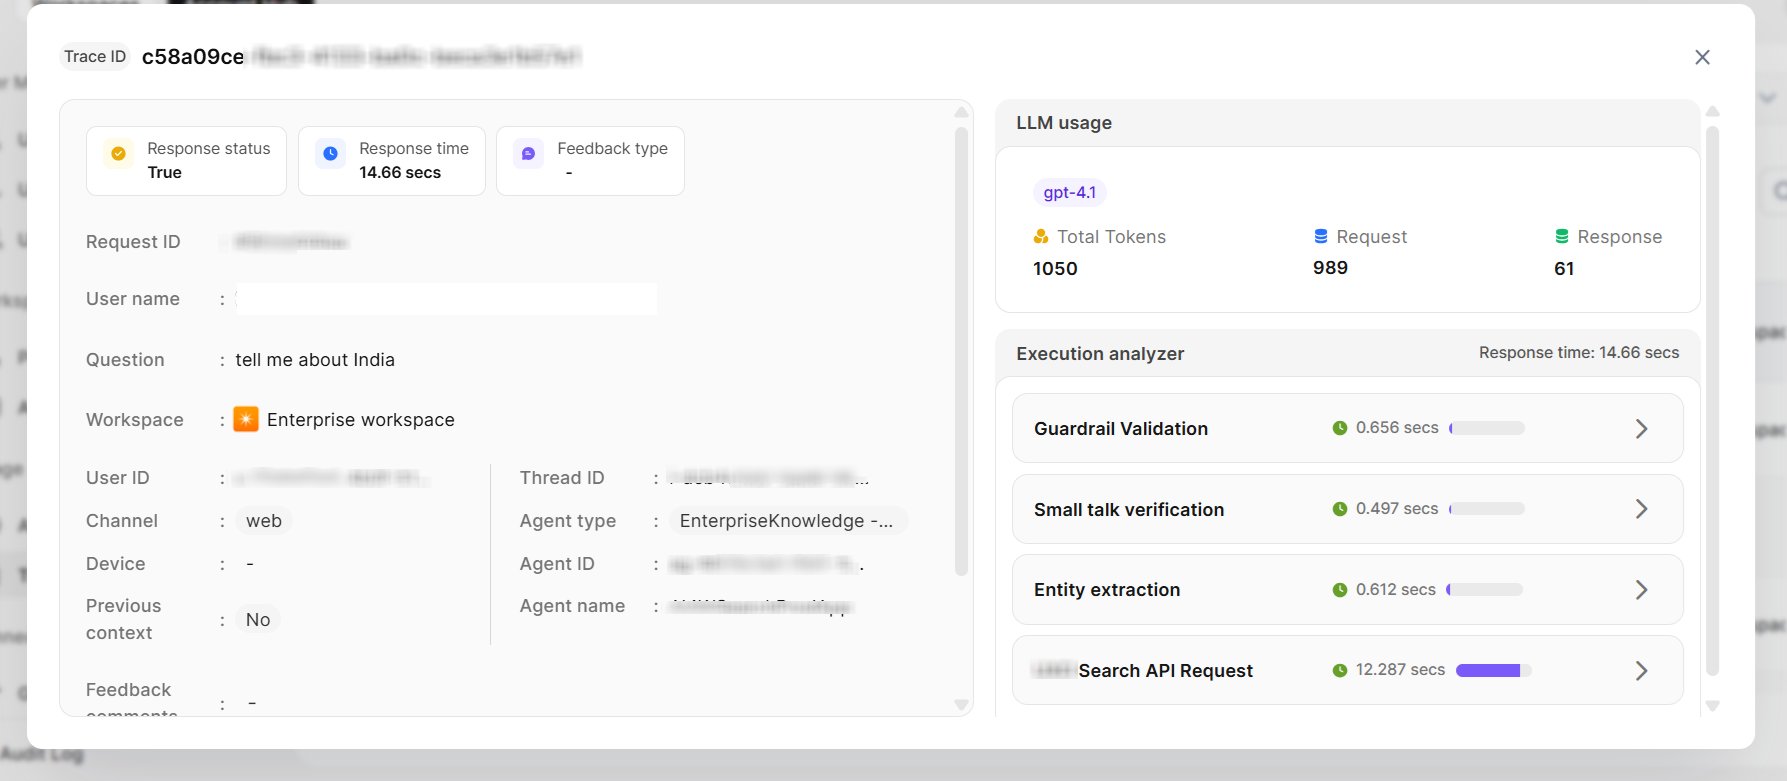
Click More on any record to open a detailed view. At the top of the detail panel, you can see the Response Status, Response Time, and Feedback Type for that record.
Record Details
Request Information
Query Details
LLM Usage
Execution Analyzer
- View the exact prompt sent to the model
- Review the model’s response
- Debug individual steps to identify issues