Key Capabilities
Access Adherence Heatmap
Navigate to Quality AI > AutoQA > Adherence Heatmap.
Enable Auto QA in Settings > Quality AI General Settings to access this feature.
Adherence Analysis and Metric Behavior
Adherence Percentage Calculation
The system calculates adherence using only evaluated interactions that are eligible for aggregation, based on the selected evaluation form, agent, and date range.Formula
Handling Flagged Interactions
By default, the system excludes interactions marked Below Threshold or Duration Unavailable from adherence metrics and dashboard aggregates unless you manually evaluate them. After manual evaluation, the system includes these interactions in heatmap calculations and treats them as standard evaluated interactions. An interaction may fall below the threshold for one scorecard but remain eligible for another depending on scorecard-specific duration rules. Duration checks don’t block ingestion, transcript storage, or Conversation Mining access. Flagged interactions remain available in Conversation Mining through the Duration Status filter (All, Evaluated Only, Below Threshold, and Duration Unavailable). The system also displays exclusion reasons and supports drill-through behavior in interaction details.Interaction Eligibility Rules
Metric Applicability
Color Coding
Each heatmap tile is color-coded by adherence percentage. Red indicates 0% adherence, green indicates 100% adherence, and intermediate values display in 10% increments between red and green. The system displays gray when no eligible evaluated interactions match the selected filters.Failed and Fatal Interactions
Hover Tooltip
Hover over a tile to view the adherence percentage, adhered interactions, and total applicable interactions for the selected metric and date. The tooltip excludes Below Threshold and Duration Unavailable (flagged) interactions unless they’re manually evaluated.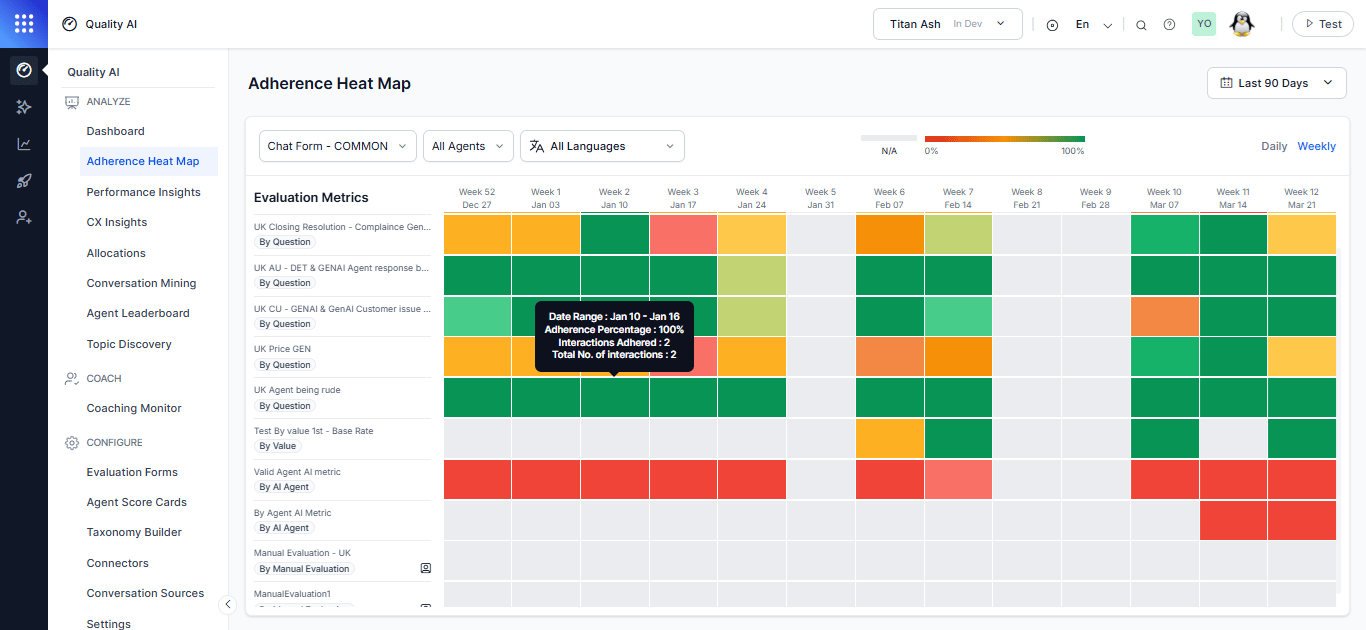
Filters
The Adherence Heatmap supports shared filters for detailed analysis across evaluation forms, queues, channels, languages, agents, and interaction direction.Date Range
Use the Date Range filter to view interaction data. By default, the system displays data for the last 7 days and uses the user’s system time zone. You can choose predefined ranges such as Yesterday, Last 7 Days, Last 28 Days, and Last 90 Days, or select a Custom Range of up to 31 days. Custom ranges display data from 12:00 AM to 11:59 PM in the user’s time zone.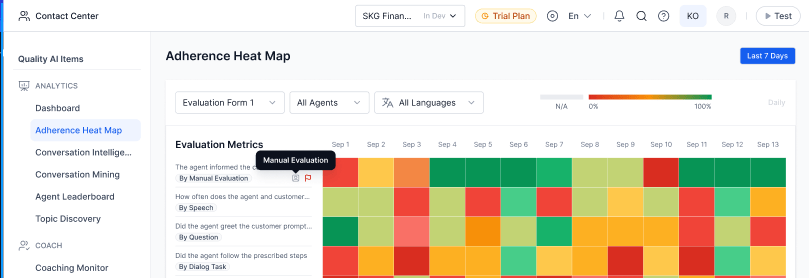
Manual Evaluation Metrics Indicator
Displays Manual Evaluation metrics with a visual identifier and represents unaudited conversations when no data is available in the Adherence Heatmap.Evaluation Form
Select one or more evaluation forms to scope adherence metrics across the heatmap. The selected evaluation forms determine the available queues, metrics, agents, and languages. You can mark an evaluation form as default. The system applies the selected form consistently across the Adherence Heatmap widget and QA Dashboard for unified analysis.Queues
Select one or more queues linked to the selected evaluation forms. The Queues filter depends on the Evaluation Forms selection and displays only associated queues. When you update the queue selection, the heatmap refreshes automatically to display adherence data scoped to the selected queues. Select an evaluation form before selecting a queue.
Interaction Directions
Analyze adherence by interaction direction—Inbound (customer-initiated), Outbound (agent-initiated), or All Directions (combined). All Directions are the default selection and aggregate adherence totals and percentages across all eligible interactions.Agent
Supports multi-select. The system displays all agents in the selected queues by default. Users with the Cross Queue Data Access permission can search and select agents across all queues. You can search and select agents to view adherence for their interactions; only relevant tiles remain active, while others display disabled.Language
Supports multi-select filtering based on configured languages. When applied, the heatmap displays adherence metrics only for the selected languages.Language options depend on the selected evaluation form.
AI Agent
Enable supervisors filter using Experience Flow tags (for example: Payment Status, Account Balance, Address Update) with search, multi-select, and expandableShow all options.
Human Agent
Allow filtering by Queues and Agents, both supporting multi-select tagging, search, andShow all expansion for easier selection.
Heatmap Interactions
Adherence Heatmap Overview
The heatmap tracks agent adherence across selected evaluation metrics over the chosen date range, based on filters selected such as agents, evaluation form, and Language. Each tile represents adherence performance for a specific metric and period based on the selected filters.Adherence Display
The system sorts adherence percentages from lowest to highest by default to help supervisors identify low-performing metrics and agents.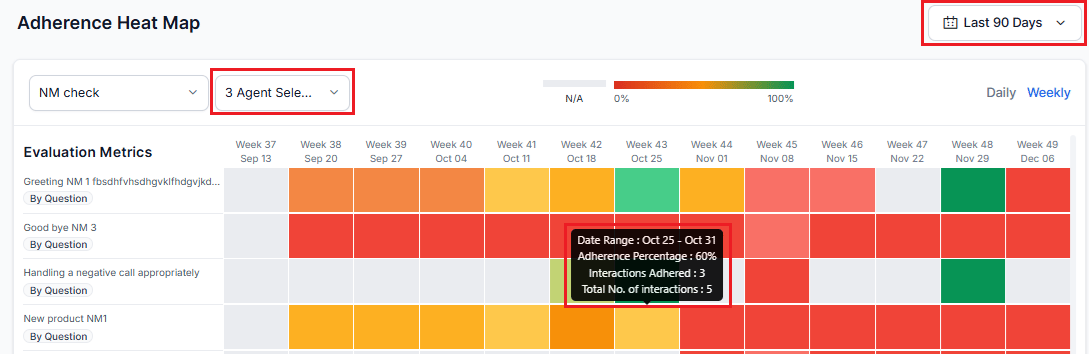
Agent-Level Breakdown
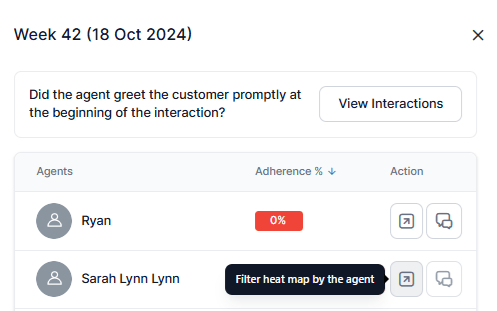
Select a date tile to open an agent-level adherence breakdown for the selected metric. The system displays agents from lowest to highest adherence percentage.
View Interactions
Select View Interactions to open Conversation Mining page with pre-applied filters for failed interactions associated with the selected metric. The system applies metric qualification (pass or fail count) filters automatically and displays them as unsaved filters.
Interaction Display Behavior
Agents with no applicable interactions display at the bottom of the list.

Action Filters