

- Measure user satisfaction.
- Analyze click-through behavior.
- Understand the result engagement quality.
- Identify negative feedback trends.
- Navigate to Analytics.
- Under Search AI, select Feedback Insights.
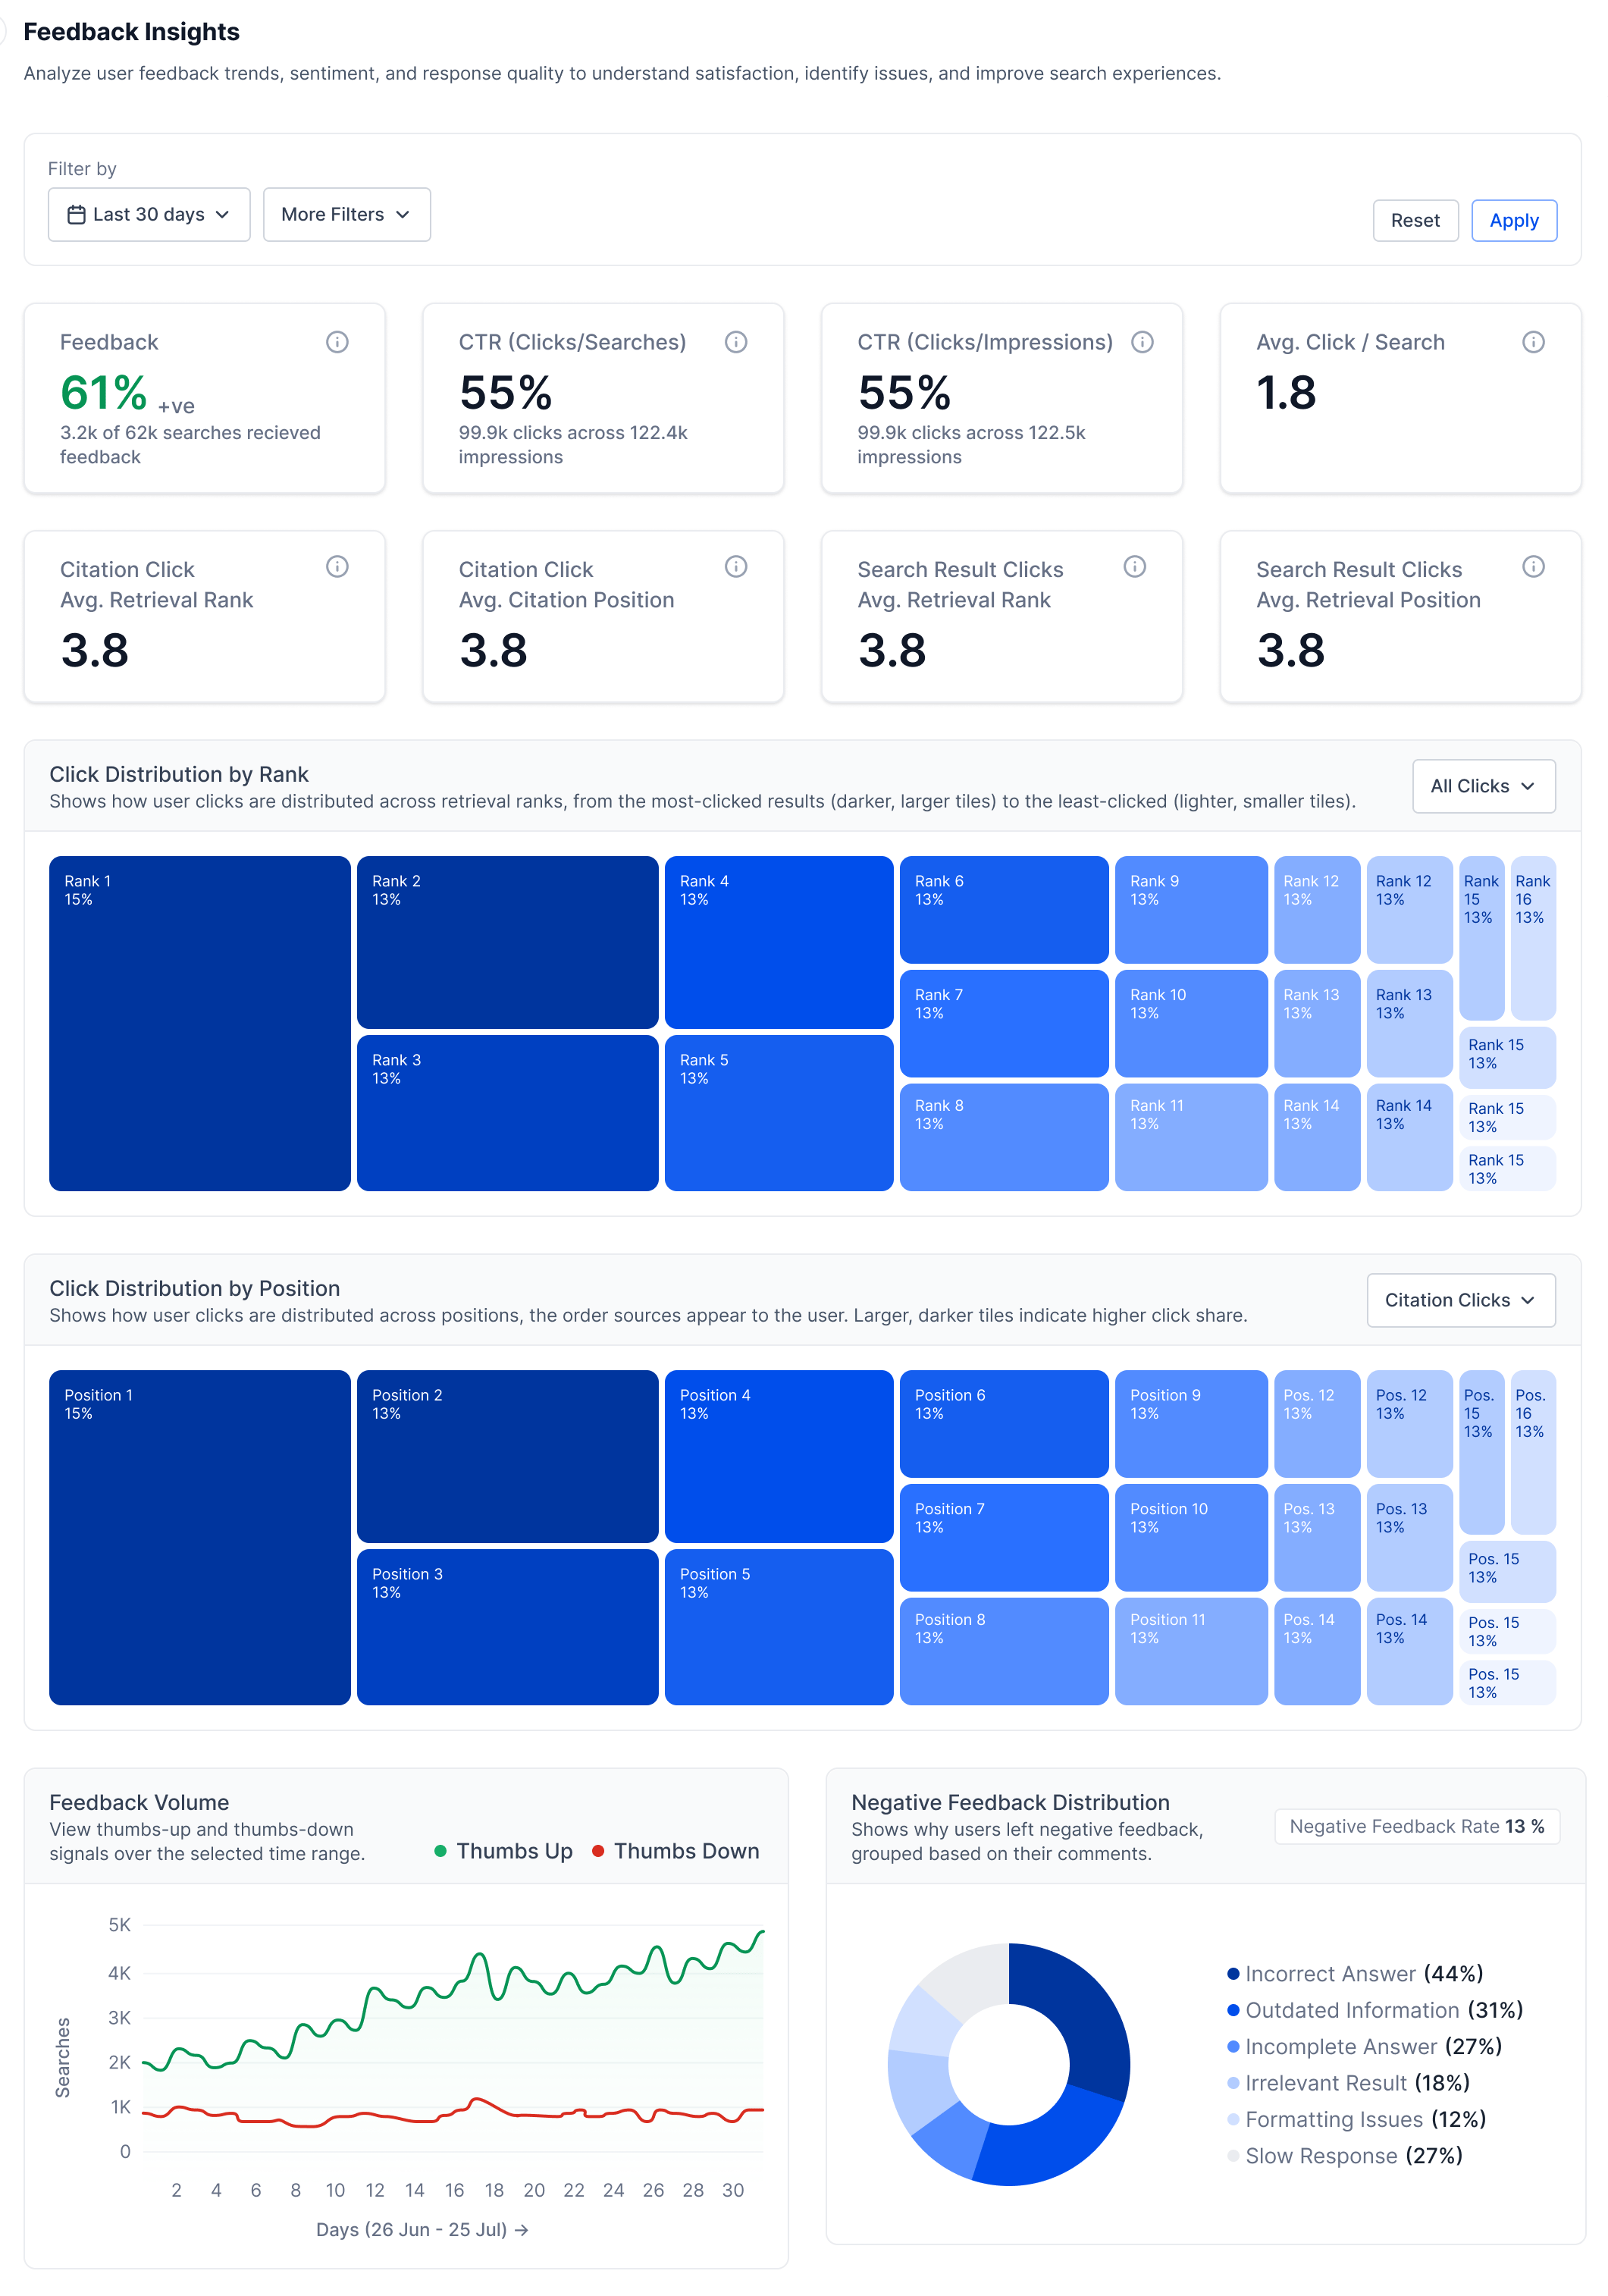
Feedback Overview Metrics
Click Distribution by Rank
This visualization shows how clicks are distributed across retrieval ranks. Use this section to:- Understand which ranked results receive the most engagement
- Evaluate retrieval effectiveness
- Analyze click concentration patterns
- All clicks
- Citation clicks
- Search result clicks
Click Distribution by Position
This visualization shows how clicks are distributed based on result or citation position. Use this section to:- Analyze user interaction patterns
- Understand engagement with displayed citations and results
- Evaluate answer and citation placement effectiveness
Feedback Volume
The Feedback Volume chart displays thumbs-up and thumbs-down activity over time. Use this section to:- Monitor feedback trends
- Identify sudden increases in negative feedback
- Track user satisfaction over time
Negative Feedback Distribution
This section categorizes negative feedback provided by users. Use this section to identify common user issues, analyze recurring feedback patterns, and then use them to improve answer quality and retrieval relevance.Use More Filters to filter analytics by Interaction Type, Channels, or Custom Analytics Metadata. Custom Analytics Metadata filters use the metadata sent in the
analyticsMetadata field of the Advanced Search API request.