

- Navigate to Analytics.
- Under Search AI, select Engagement.
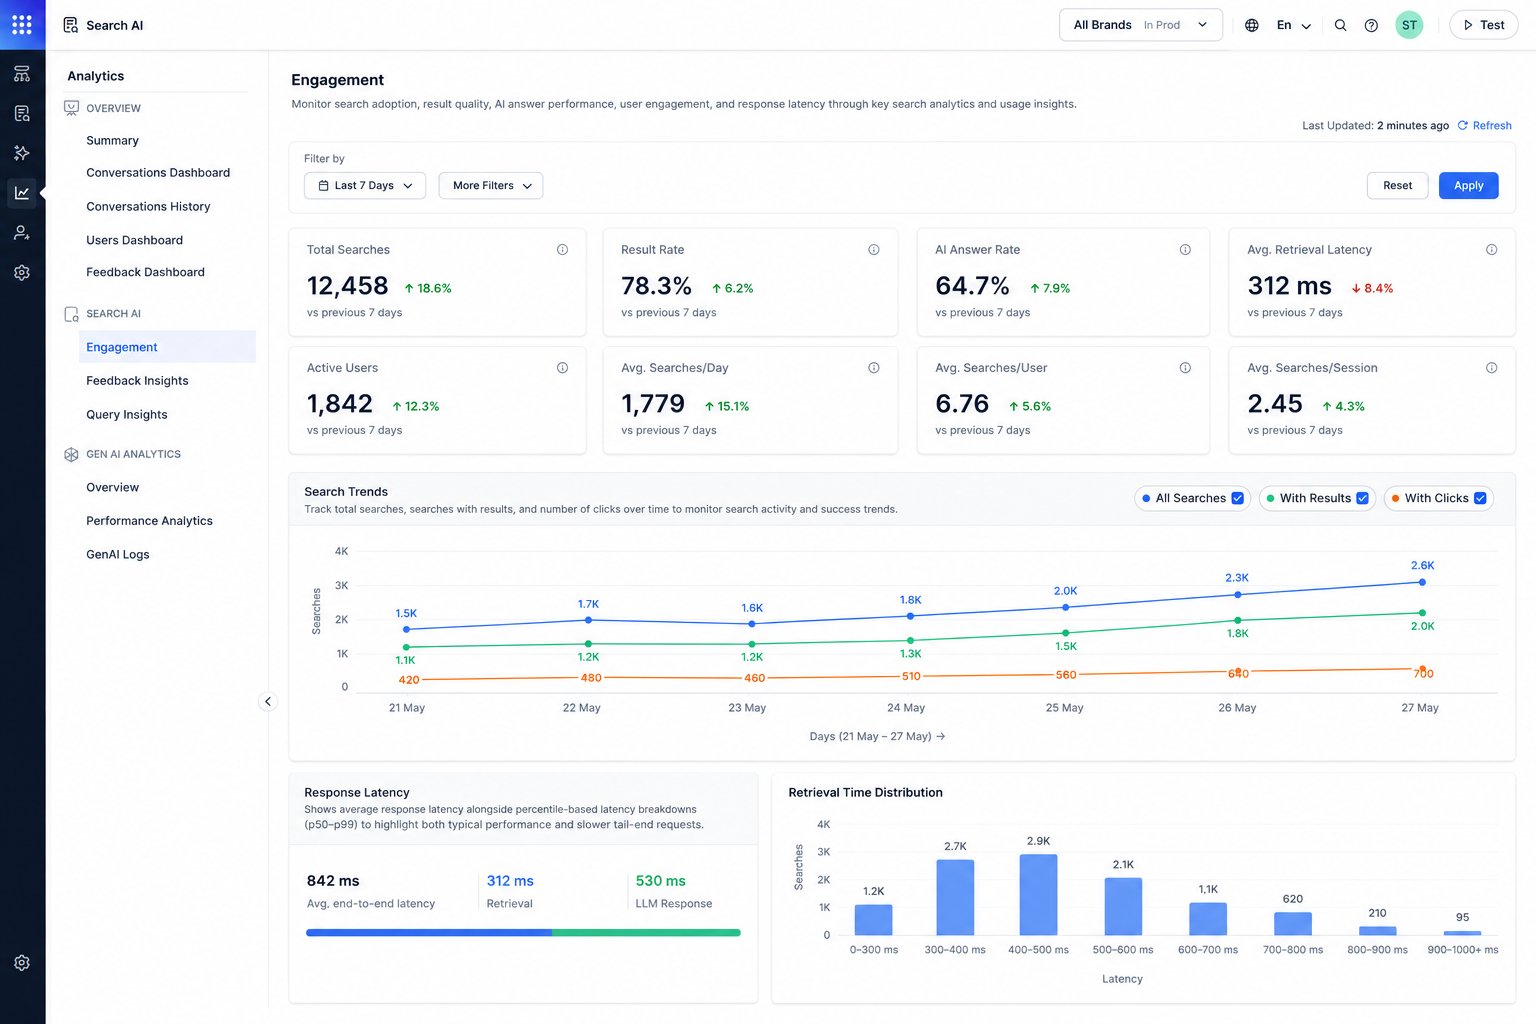
Key Engagement Metrics
Search Trends
The Search Trends chart helps visualize search activity over time. The chart displays:- All searches.
- Searches with results.
- Searches with clicks.
Response Latency
The Response Latency section helps monitor search response performance. This section includes:- Average end-to-end latency
- Retrieval latency
- LLM response latency
- Identify slow response patterns.
- Monitor overall answer performance.
- Analyze retrieval and generation delays.
Retrieval Time Distribution
The Retrieval Time Distribution chart shows how searches are distributed across latency ranges. Use this chart to:- Understand typical retrieval performance.
- Identify slow-performing searches.
- Monitor latency consistency across requests.
Use More Filters to filter analytics by Interaction Type, Channels, or Custom Analytics Metadata. Custom Analytics Metadata filters use the metadata sent in the
analyticsMetadata field of the Advanced Search API request.