Accessing the Dashboard
- Select Analytics on the left navigation pane.
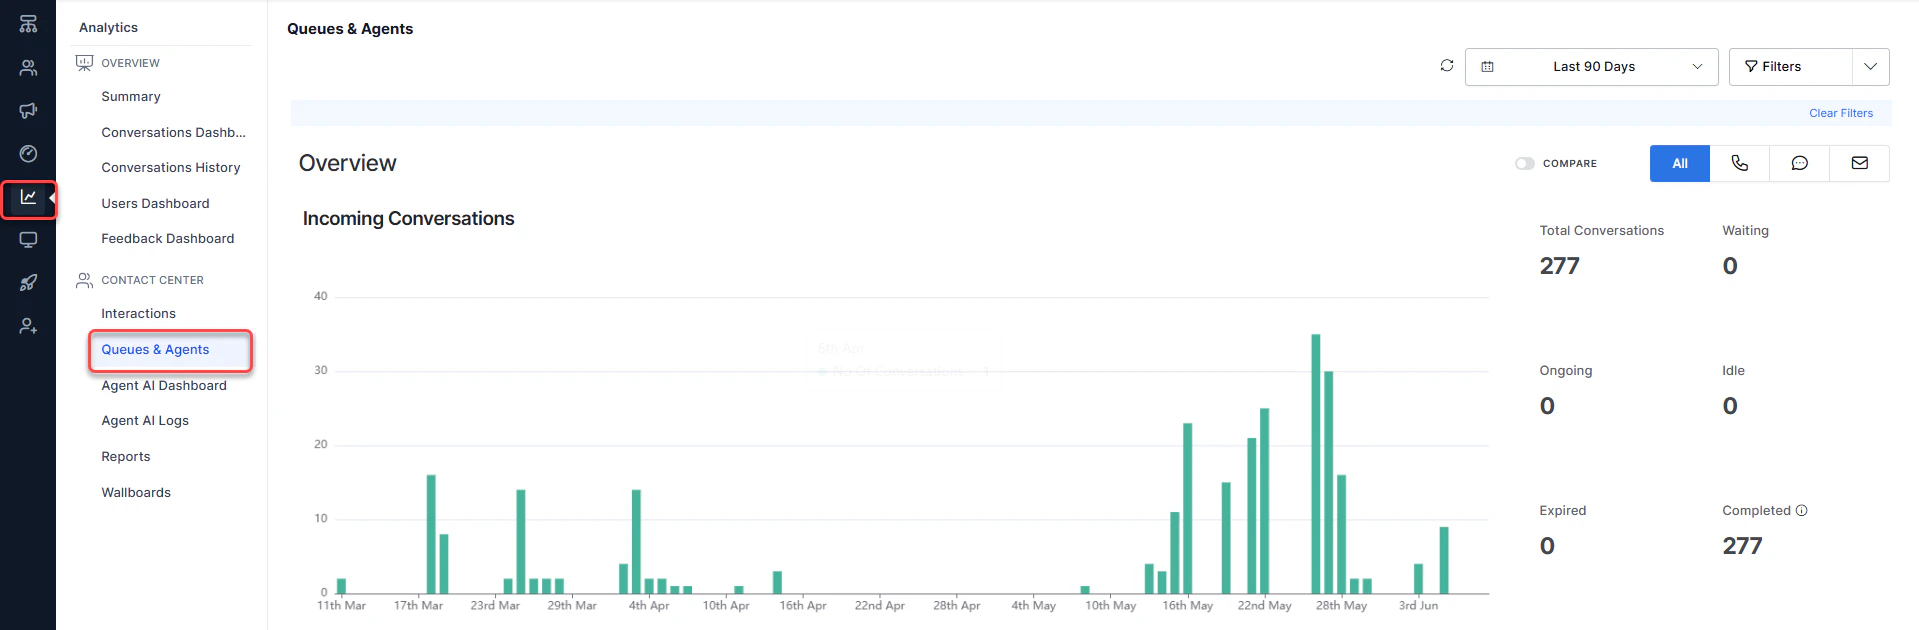
- Select Queues & Agents under the Contact Center section. The dashboard displays on the right side of the page.
Time Selection
Filter data for a specific time range by selecting a range and selecting Apply.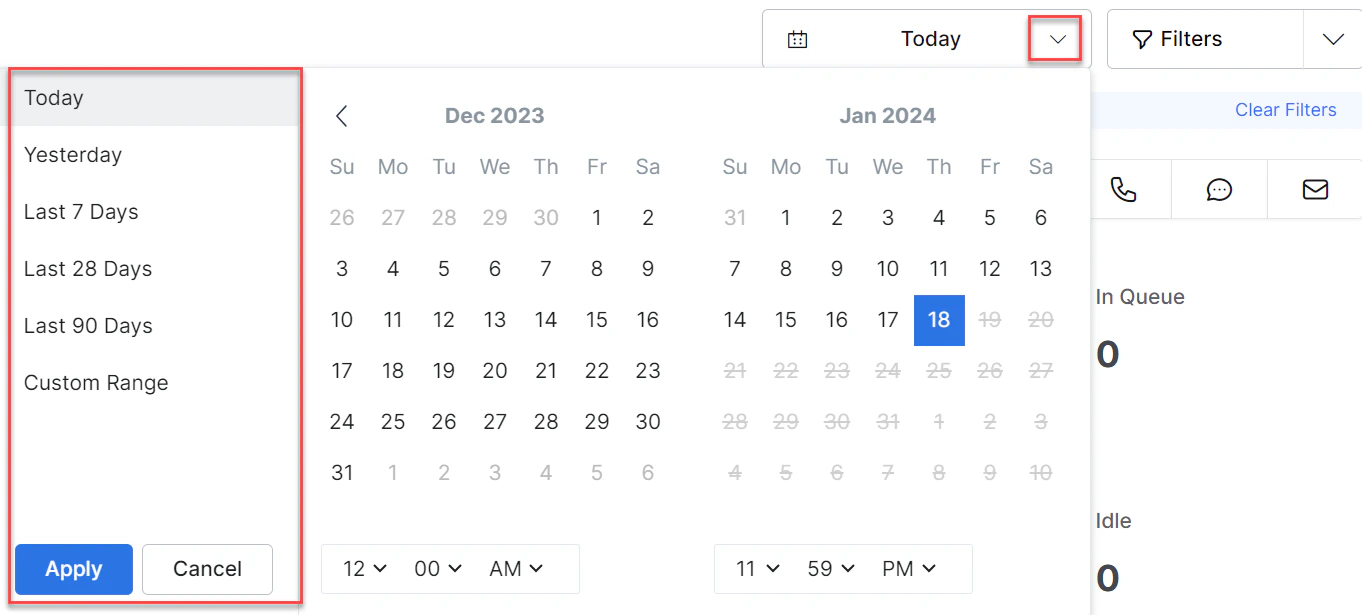
Filters
You can create, save, edit, copy, and delete filters to avoid repeatedly setting the same options.Create Filter
- Select Filter.
- Select New Filter.
- Select the Queues, Channels, Direction, and Agents.
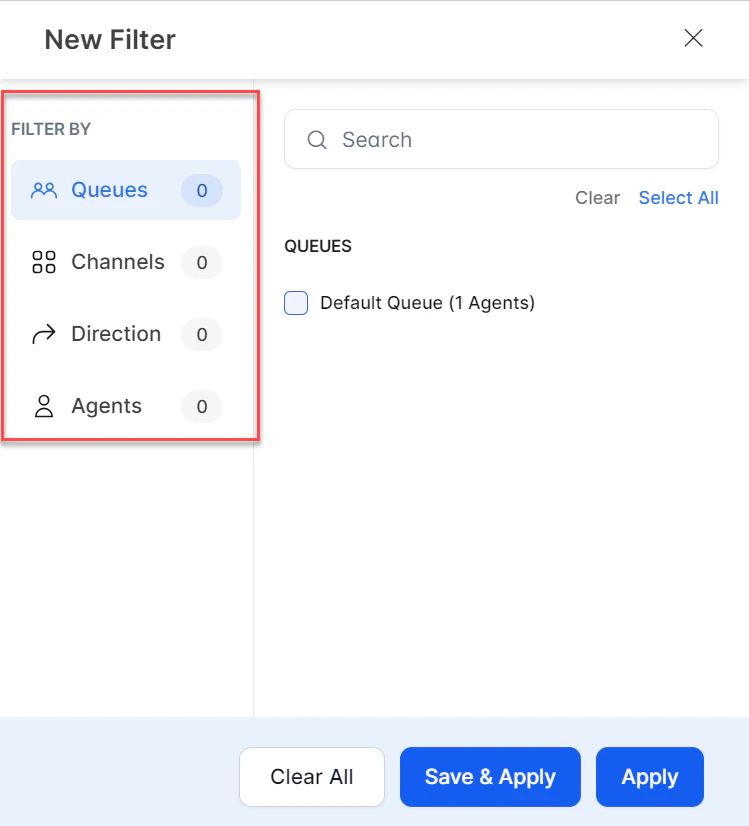
- Select Save & Apply.
- Enter a name for the filter and select Save & Apply.
Edit Filter
- Select the Filters tab. The saved filter name appears.
- Select Edit.
- Make the necessary changes and select Save & Apply.
Copy Filter
- Select Duplicate.
- In the Rename Filter window, enter a name and select Save.
Mark as Default
- Select Mark as Default.
Delete Filter
- Select Delete.
- In the confirmation window, select Delete.
Overview of Incoming Conversations
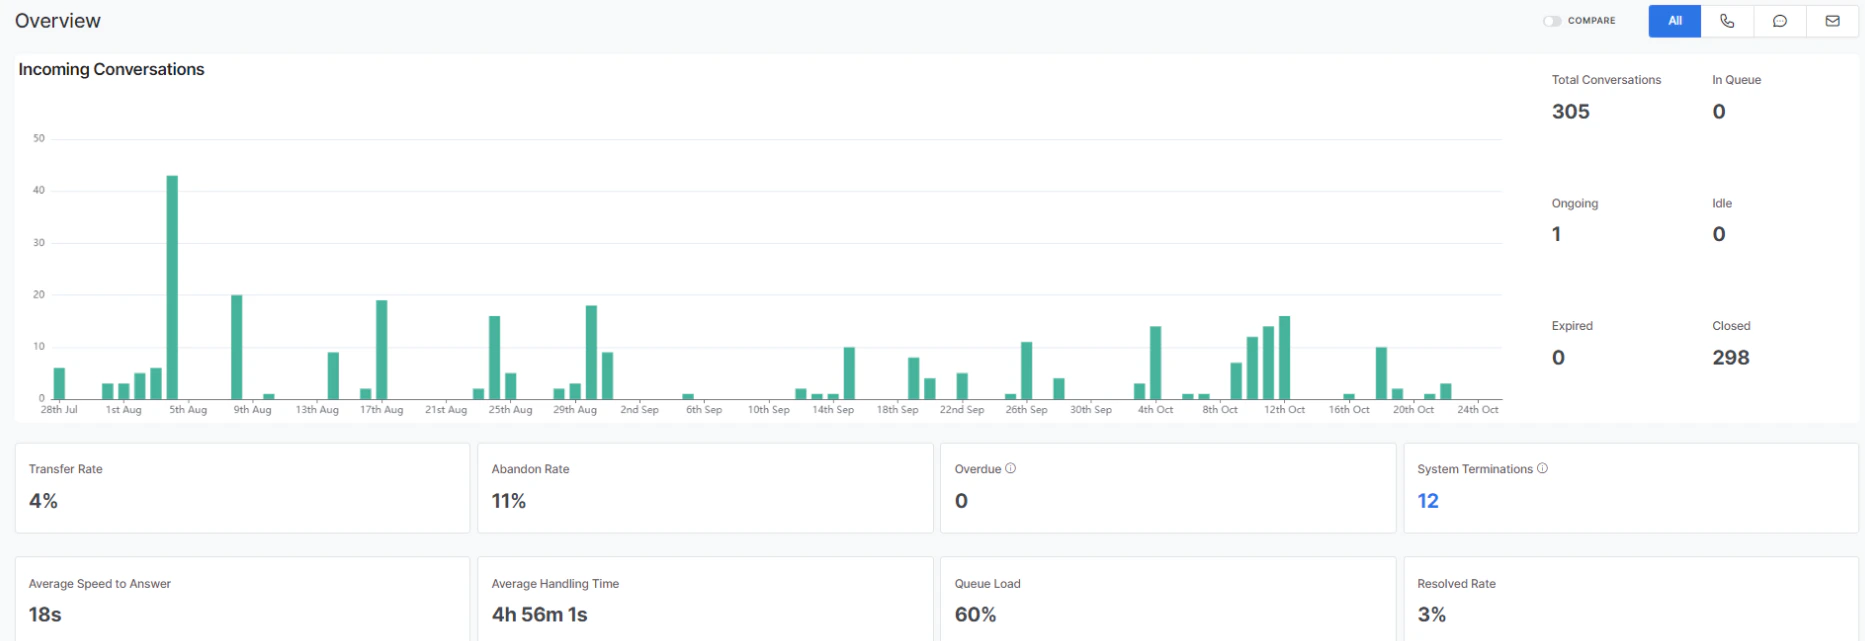
This section displays metrics for all conversations (phone, chat, and email).
COMPARE: The COMPARE toggle compares historical metrics against a previous equal-sized time range. For example, if Average Handle Time is 12m 2s for the last 30 days and was 6m 1s previously, selecting Compare shows a 50% increase.
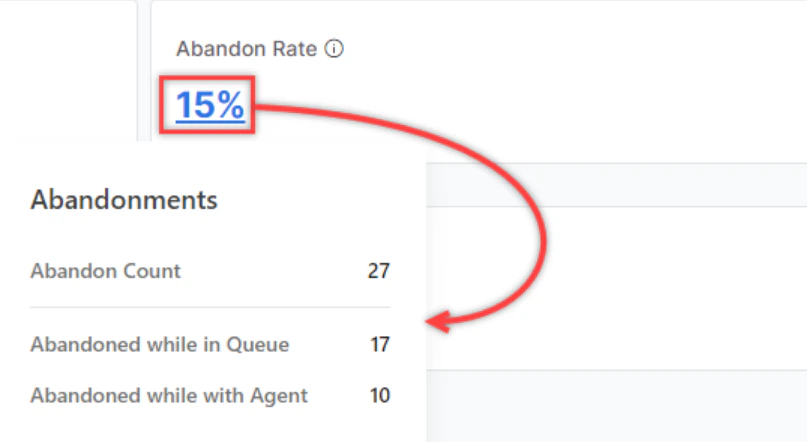
- Abandoned while in Queue: Count of conversations abandoned while waiting in the queue.
- Abandoned while with Agent: Count of conversations abandoned while attended by an agent.
- Digital Channels:
Abandon Count= User Abandons While Waiting in Queue + Conversations With Agent that went through the Idle-Expired Sequence - Voice Channels:
Abandon Count= User Abandons While Waiting in Queue + Conversations With Agent where User Disconnects While Agent has the call on hold
Efficiency
This section displays individual metrics for all conversations (call, chat, and email).Voice Metrics
- Average Speed to Answer
- Average Handle Time
- Average Pick-up Time
- Average Engagement Time
- Average Talk Time
- Average Mute/Hold Time
Chat Metrics
- Average Speed to Answer
- Average Handle Time
- Average First Response Time
- Average Agent Response Time
- Average Customer Response Time
Transfers
- Transfer Rate
- Call Transfers
- Chat Transfers
- The Resolution Disposition Set is the default and appears in the Disposition & Notes section of the Live Interactions pane in the Agent Console.
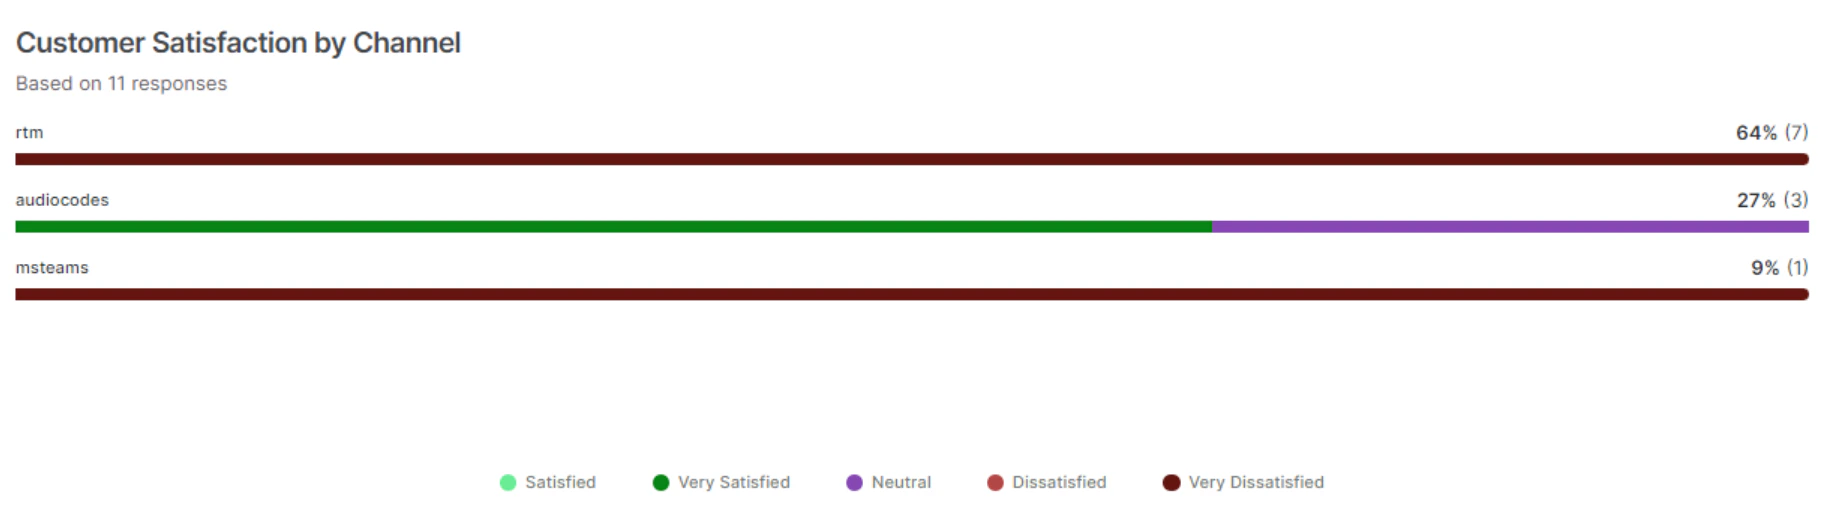
- A multi-colored progress bar appears for codes in the selected Disposition Set.
- Separate progress bars appear under each Disposition Code.
Agent Performance
This section displays agent performance metrics for all conversations (call, chat, and email).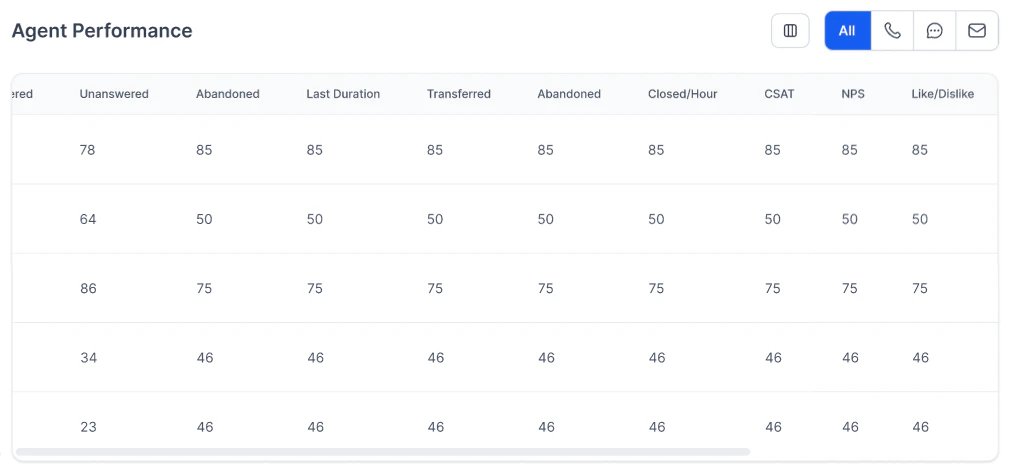
Agent Performance Metrics
Queue Performance
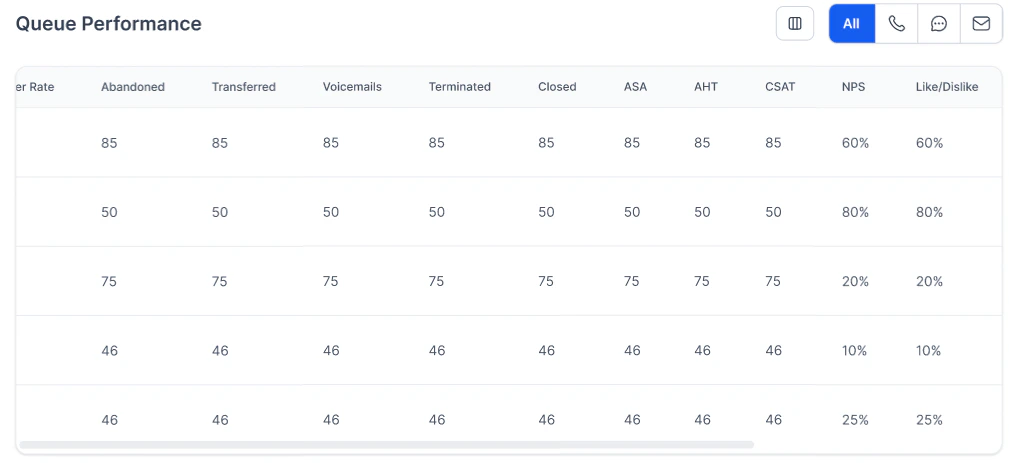
This section displays queue performance metrics for all conversations (call, chat, and email).