

-
Click Analytics on the left navigation pane. The Analytics panel opens with the list of reports.
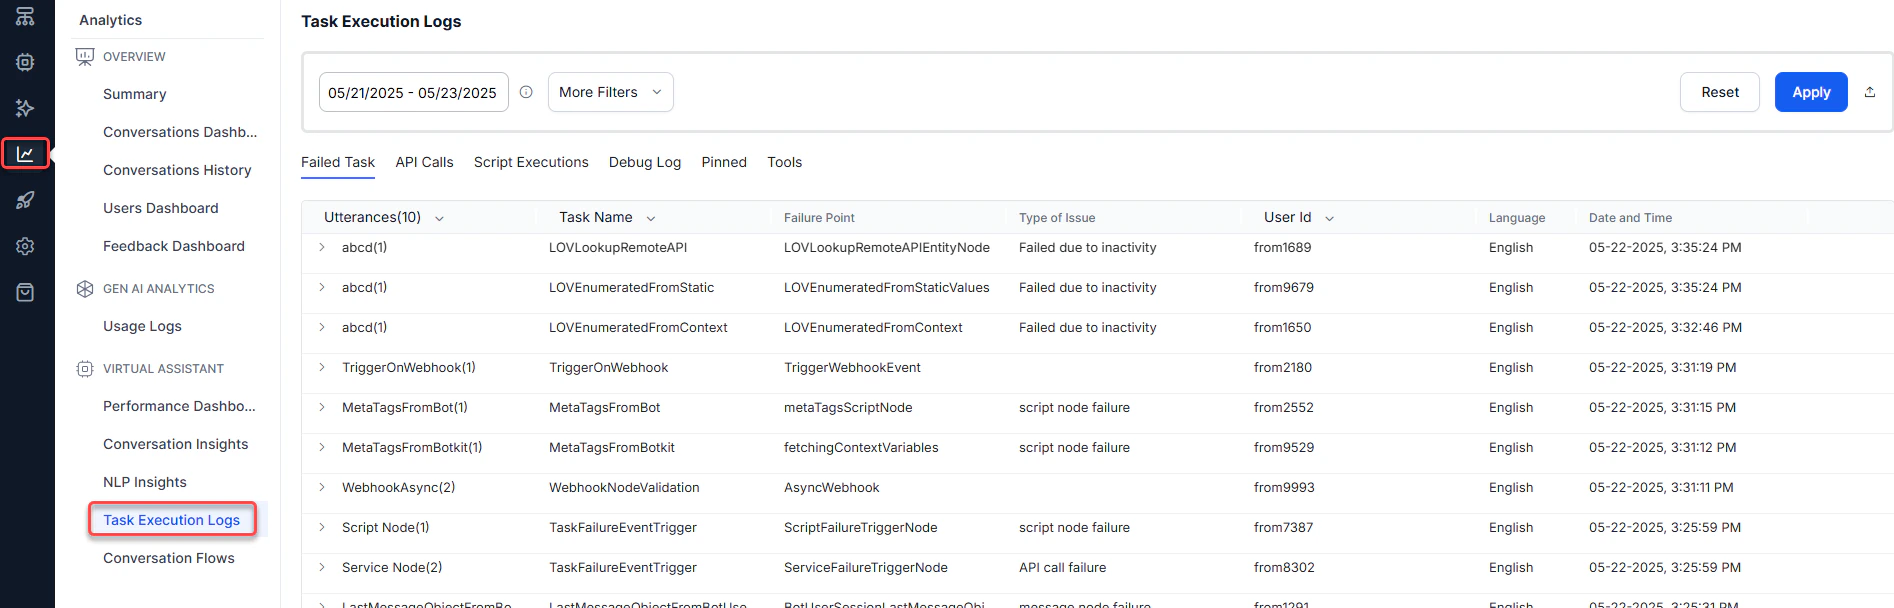
- Click Task Execution Logs under the Automation section of the Analytics panel.
- Select appropriate filters and click Apply.
- Failed Task: Indicates the number of unsuccessful tasks.
- API Calls: Displays Service node and Webhook node execution data and the number of failed services during AI Agent interactions.
- Script Execution: Displays analytics data for script node executions and the number of failed scripts during AI Agent interactions.
- Debug Log: Custom debug logs including user conversations from all channels for analyzing your AI Agent.
- Pinned: Pinned Task Execution Log records for easy access and viewing.
Task Execution Logs Fields
Failed Task
When user utterances are successfully mapped to an intent but the task can’t be completed, those utterances appear under this tab. Group them by task and failure type to analyze and resolve issues.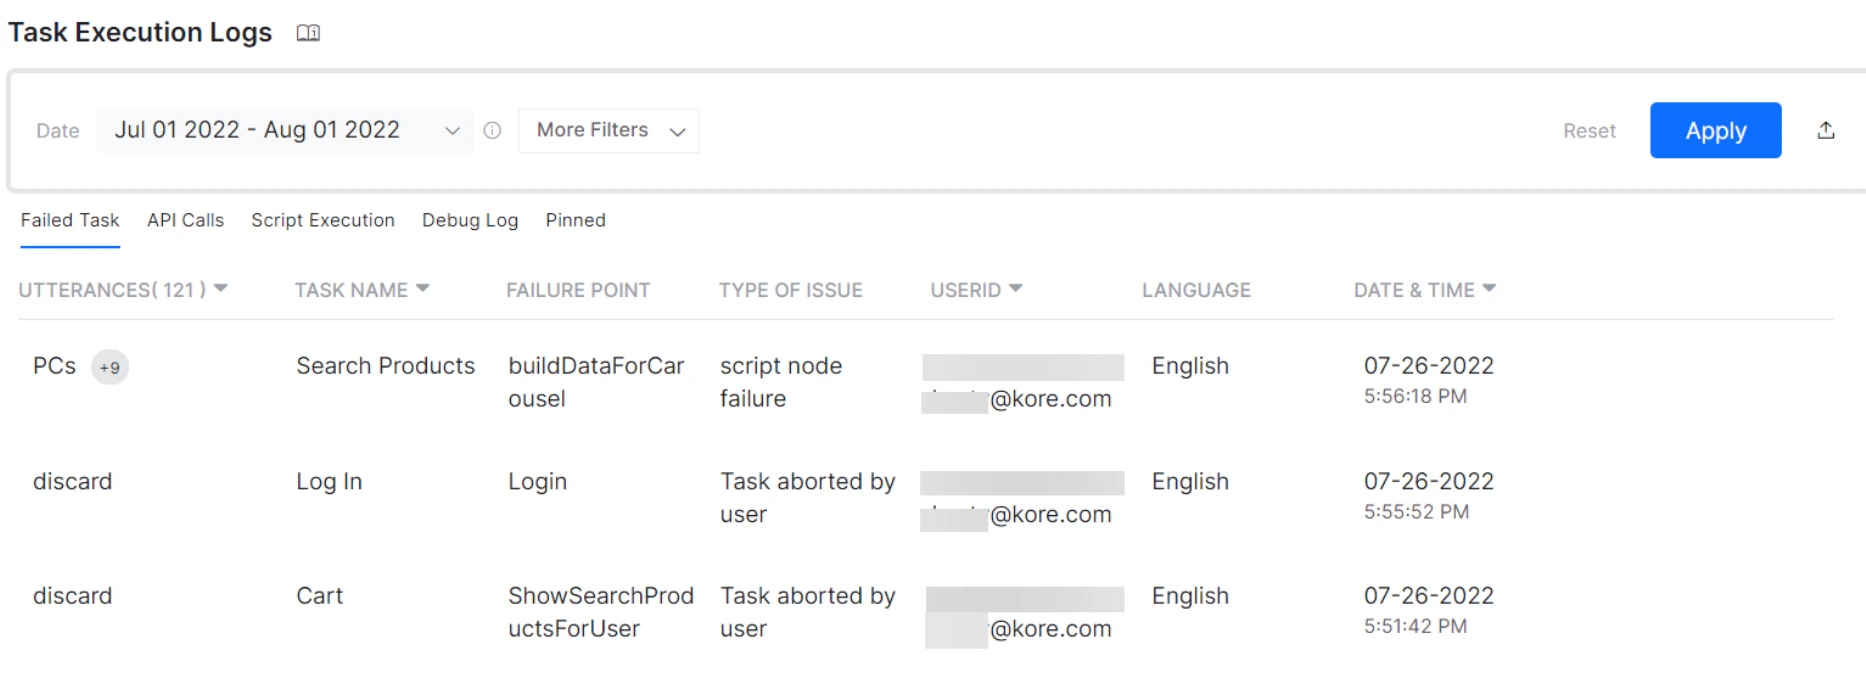
Failed Task — Type of Issues
The following types of issues can occur during a failed task:- Task aborted by user
- Alternate task initiated
- Chat interface refreshed
- Human-agent transfer
- Authorization attempt failure — Max attempts reached
- Incorrect entity failure — Max attempts reached
- Script failure
- Service failure
- Inactivity or External Events (from version 8.0) — when the conversation session and in-progress task is closed due to inactivity or external events
Performance
Developers can monitor all scripts and API services across the AI Agent’s tasks from a single window. The Performance tab displays information in two sections: API Calls and Script Execution.API Calls
The API Calls section provides information on API execution performance based on the following metrics:- Node name, type, and task name
- Success %
- Total number of calls with 200 responses and with non-200 responses (view the actual response code from the details page opened by clicking the service row)
- Average response times
| Field | Description |
|---|---|
| Node Name | The name of the service, script, or Webhook within the task. Click the Node Name header to enable Group by NodeName. |
| Type | Indicates whether it’s a script, service, or Webhook. Webhook details are included from version 7.0. |
| Task Name | The task identified for the user utterance. Click the Task Name header to enable Group by Task. |
| Success% | The percentage of service or script runs that executed successfully. |
| 2XX Responses | The percentage of service or script runs that returned a 2xx response. |
| Non 2XX Responses | The percentage of service or script runs that returned a non-2xx response. |
| Avg Response Time | The average response time of the script or service. Sortable from High to Low or Low to High under the Performance tab. |
| Status Code | Filter service executions by status code via More Filters > Status Code. Success code: 200. Non-success codes: 304, 400, 401, 403, 404, 408, 409, 500, 502, 503, and 504. 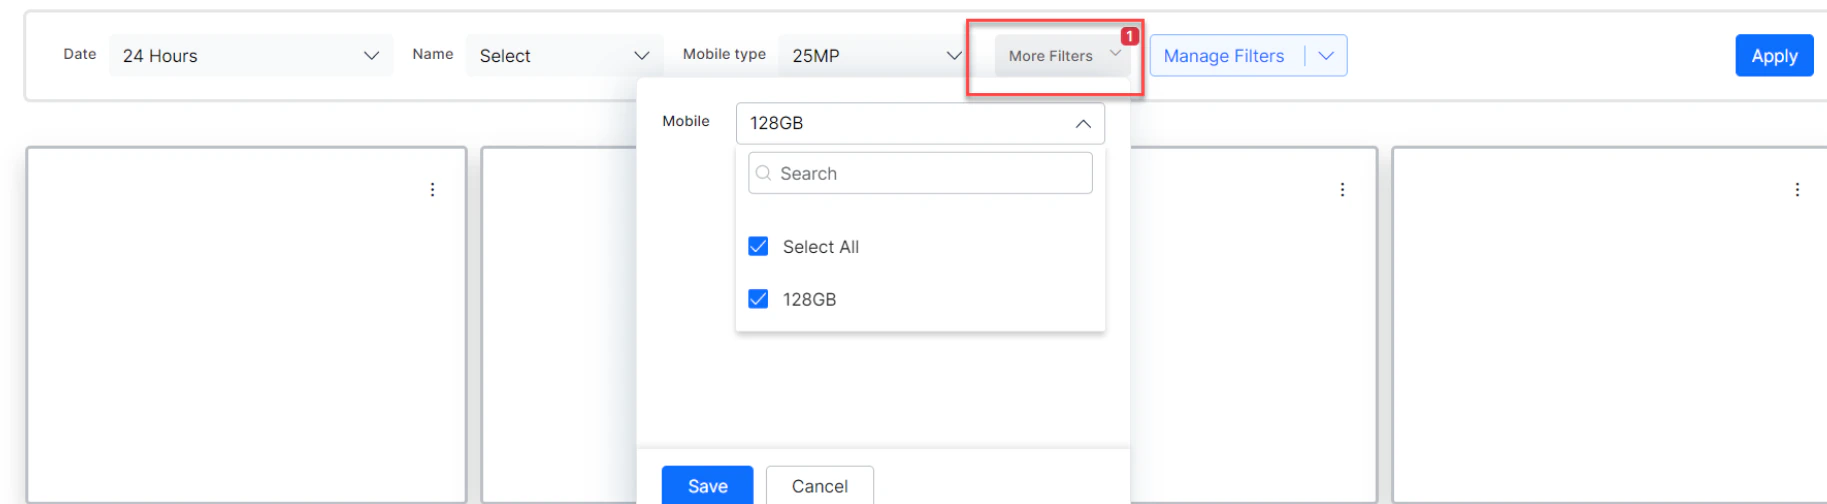 |
Script Execution
The Script Execution section provides information on script execution performance based on the following metrics:- Node name and task name
- Success %
- Average response times
- Alerts if a script or service is failing consecutively
Debug Log
Custom debug statements entered in the Script node usingkoreDebugger.log("debug statement") are displayed on this tab. Debug statements must be in string format. Logs include user conversations from all channels and are useful for AI Agent analysis, especially in case of failures.
The details include:
- The actual statement defined during AI Agent definition
- Date and time of logging
- Channel
- User ID (along with channel-specific ID)
- Language of interaction
- Task name, if available
- Click a logged record.
- The corresponding window shows Details and Chat History tabs.
- Under Details, find the task name, channel, language, and flow.
- Click the Chat History tab to find the chat transcript where the log is recorded.
- If the debug log is generated from an AI Agent message, you are navigated to that specific message in the transcript.
- If the debug log isn’t part of the AI Agent message, you are navigated to the latest message added before the debug statement.
<endpoint>, <error code>, and <response time>.
Pinned
Records pinned from Failed Tasks, API Calls, and Script Execution are displayed here. The fields available in the Pinned section pertain to Task Execution Logs.Storage Limitations
The platform imposes restrictions on the number of log statements retained per AI Agent:- Only the latest 700 statements per AI Agent are stored.
- Statements older than 7 days are removed.
Task Execution Logs Analysis
Features
- Filter information by user utterances, intent, user ID, date period, channel, language, and custom tags. See Filter Criteria for more details.
- Complete meta-information is stored for later analysis, including the original user utterance, channel, extracted entities, custom tags, and detailed Task Execution Logs.
- Pin important records for later tracking. Pinned records appear on the Pinned tab.
- Sort by Date and Time (Oldest to Newest, Newest to Oldest). Export insights data as a CSV file.
Fields Matrix
The following matrix shows field availability across Task Execution Log tabs:
* GenAI features include Answer Generation, Zero-Shot Model, Rephrase User Query, and Rephrase Responses.