Back to Analytics Overview The Performance Dashboard provides insights into your AI Agent’s NLP performance and integration metrics after it’s published. To view the Performance Dashboard:
  1. Click Analytics on the left navigation pane. The Analytics panel opens with the list of reports. Performance Dashboard Overview
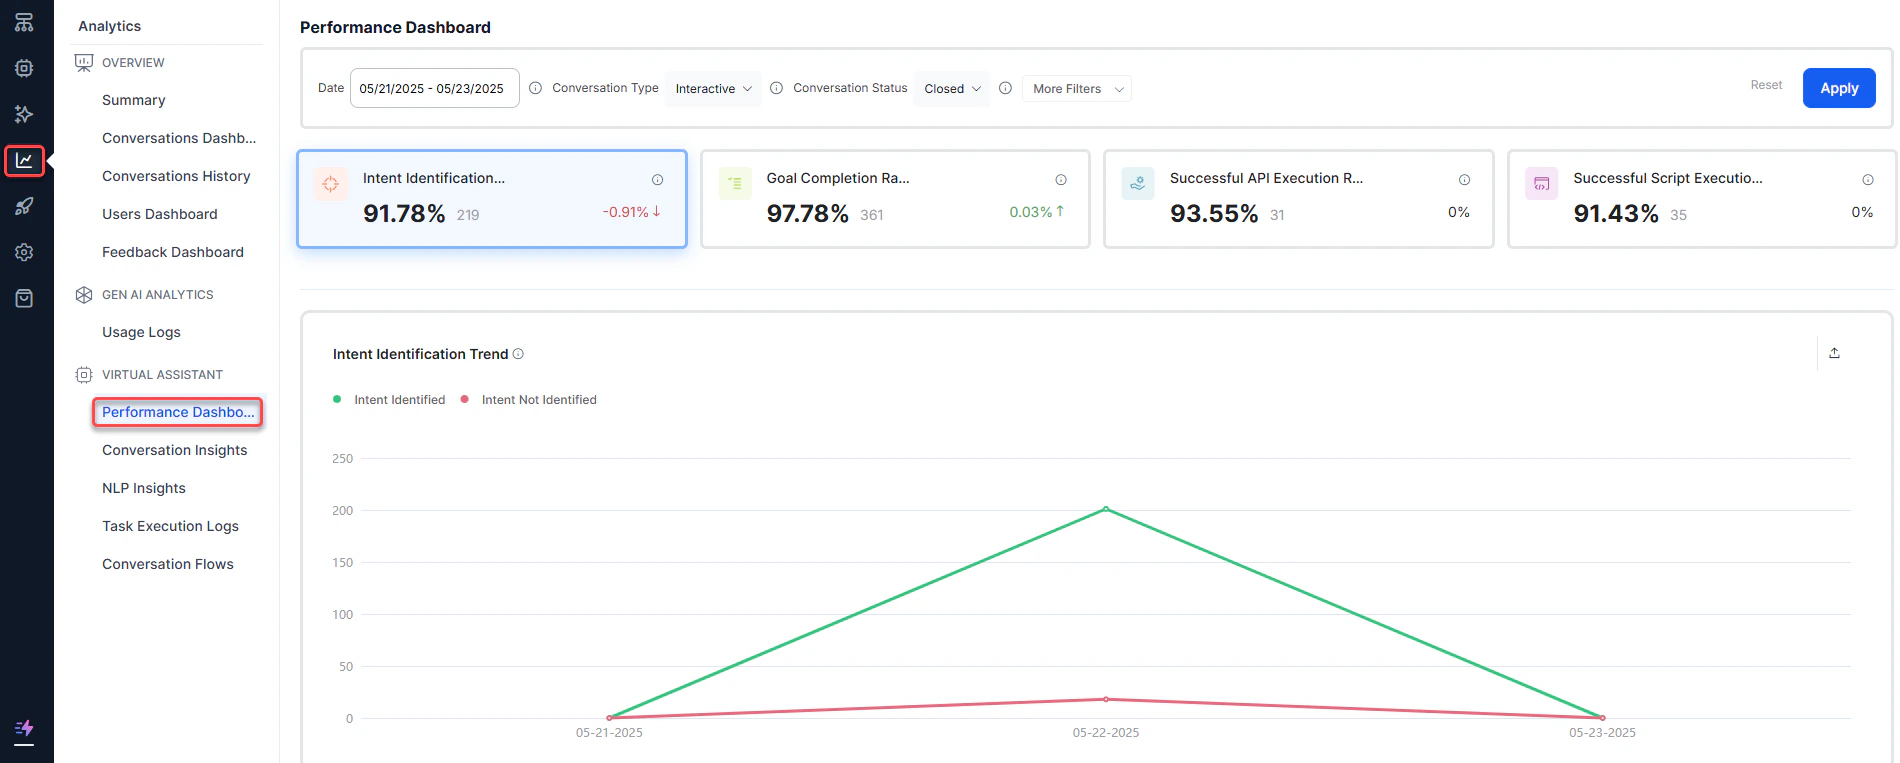
  2. Click Performance Dashboard under the Automation section of the Analytics panel.
  3. Select appropriate filters and click Apply. Performance Dashboard
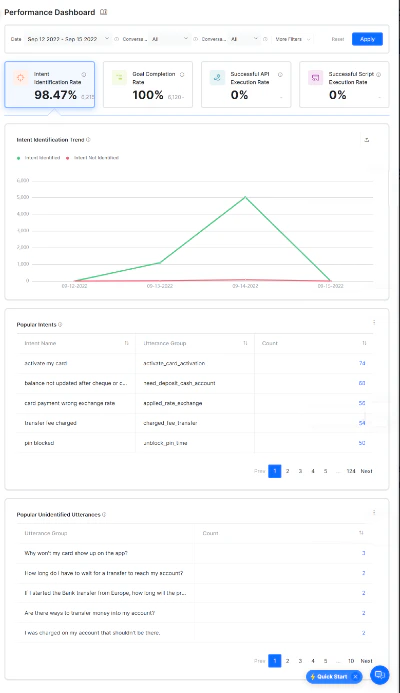
Performance Dashboard Metrics

The Performance Dashboard is organized into four categories to identify how an AI Agent performs.

Intent Identification Rate

This section provides information on the number of intents that were classified and unclassified. An intent represents the goal the customer has in mind when typing a question or comment — it’s “what they really mean.”

Goal Completion Rate

This section shows how many tasks the AI Agent completes and fails within a selected time. Failed tasks include both abandoned and incomplete tasks. Tasks include any interaction such as Dialog, FAQs, or alerts.

API Execution Rate

This section provides information on the number of APIs that were successfully executed and failed. Dialog tasks often use a Service node to make REST or SOAP requests to third-party web services.

Script Execution Rate

This section provides information on the number of scripts that were successfully executed and failed. A Script node allows you to write JavaScript code in a dialog task.

Filter Criteria

The Performance Dashboard data can be filtered using specific criteria. Learn more.