

- Identify the data points needed to derive your metrics based on business requirements.
- Define suitable Custom Meta Tags to emit these data points in the AI Agent definition.
- Design widgets, preview, and update the dashboard with these widgets.
-
Click Analytics on the left navigation pane. The Analytics panel opens with the list of reports.
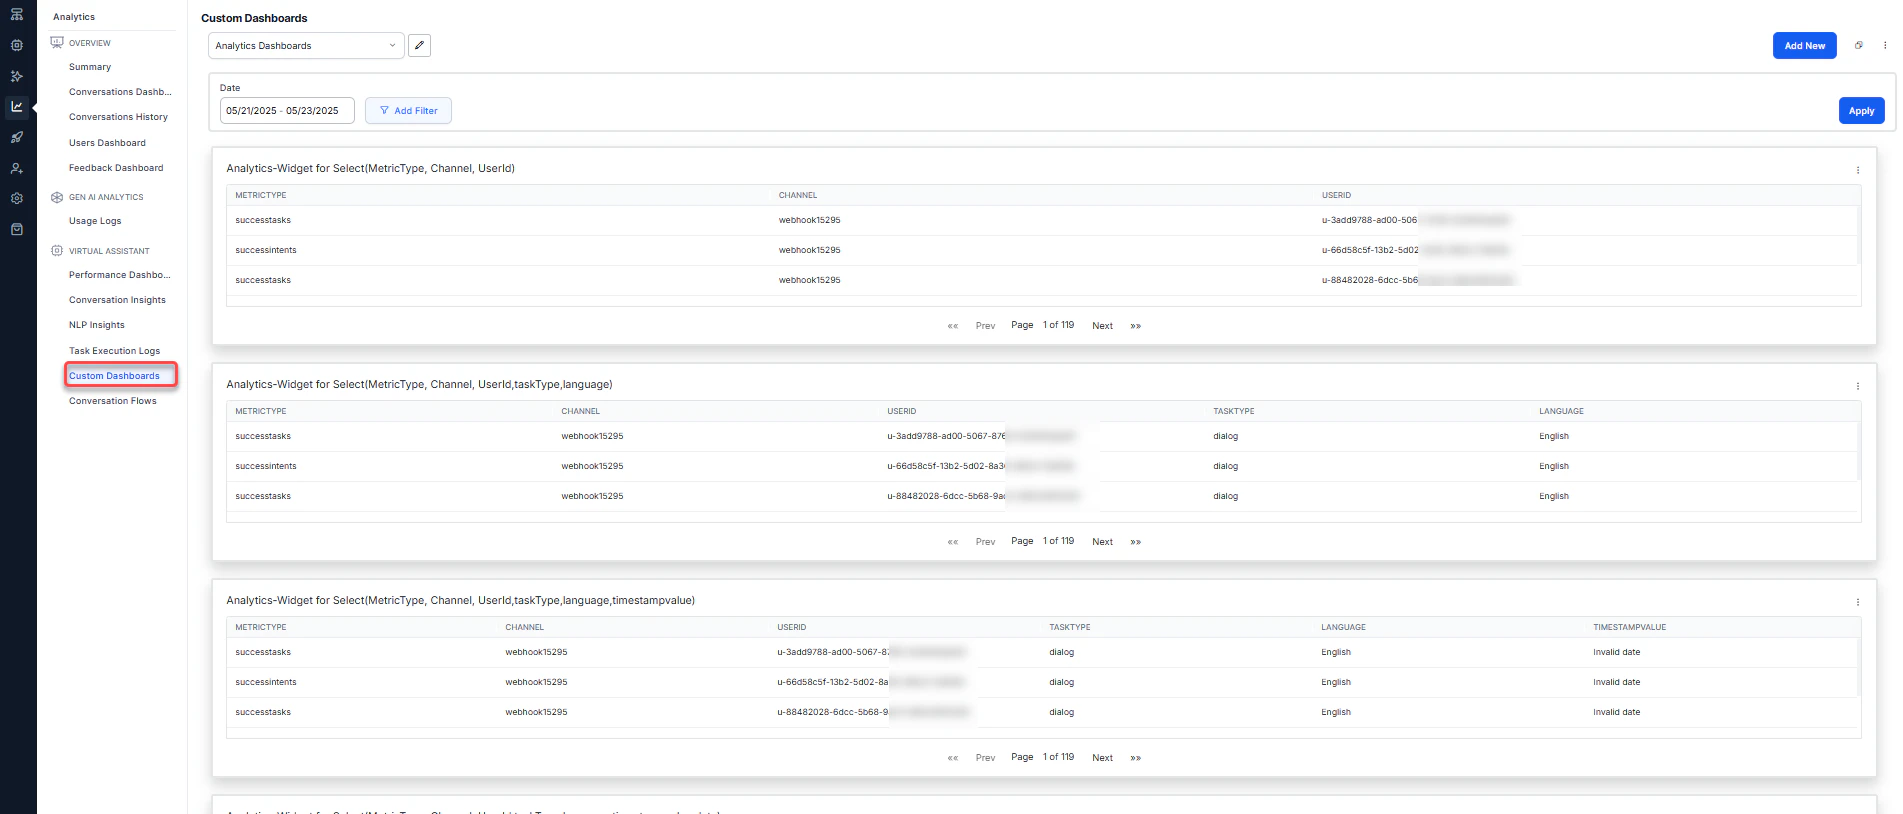
- Click Custom Dashboards under the Automation section of the Analytics panel.
- Select appropriate filters and click Apply.
- Each dashboard can have one or more widgets.
- Each widget must be associated with a dataset.
- You need to define a query to extract the required data for each widget.
Add Custom Dashboards
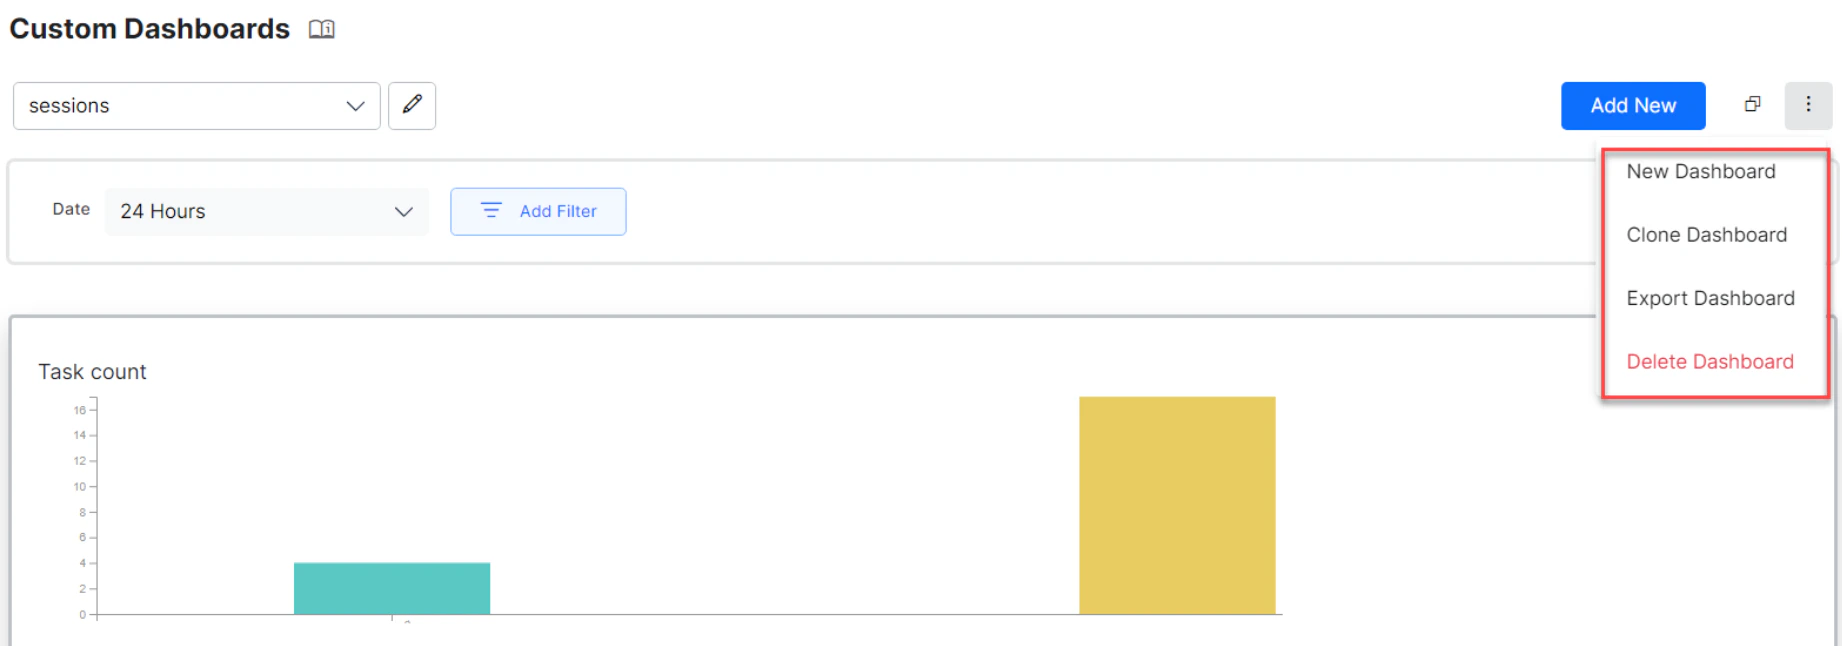
You can add one or more dashboards by providing basic details.- To add a new dashboard, click the more icon (three dots) in the top right and select New Dashboard. Enter the name of the dashboard. You can edit the name at any time.
- By default, each custom dashboard includes a Date Filter to filter records for all widgets in the dashboard. Choose between 24 hours, 7 days, and a custom date range. You can also configure and add custom filters. See Create Custom Filters for Custom Dashboard for more information.
- Choose a Color Theme for your dashboard.
- Use Add Widget to add a widget to the dashboard.
- Reorder widgets using the move cursor (visible on hover) to drag and drop widgets anywhere on the dashboard.
- Using the Kebab menu (vertical ellipses) icon, you can:
- New Dashboard: Create a new dashboard.
- Clone Dashboard: Copy the dashboard configuration to a new dashboard.
- Export Dashboard: Export the dashboard configuration as a JSON file.
- Delete Dashboard: Delete the custom dashboard.
Add Widgets
Use the Add Widget button to add one or more widgets to a dashboard. Widget configuration involves two steps:- Data Definition
- Data Representation
Data Definition
Every widget requires a query to retrieve and represent the required information. The following configurations are used to generate the query definition: Dataset defines the data source:- Analytics: Provides data about Success Intents, Failed Intents, Success Tasks, and Failed Tasks. Key fields include MetricType, Channel, UserId, and others.
- Message: Provides AI Agent and user messages. Key fields include UserId and Channel.
- Sessions: Lists conversation sessions. Key fields include UserId and Channel.
You can view the top 20 records for all dataset fields.
- Fields differ for each selected dataset. See the Dataset and Fields table for details.
- Apply aggregation functions such as
min,max,sum,count, oravg. For example,count(metricType) as total.
Aggregate functions are visible only in Advanced mode.
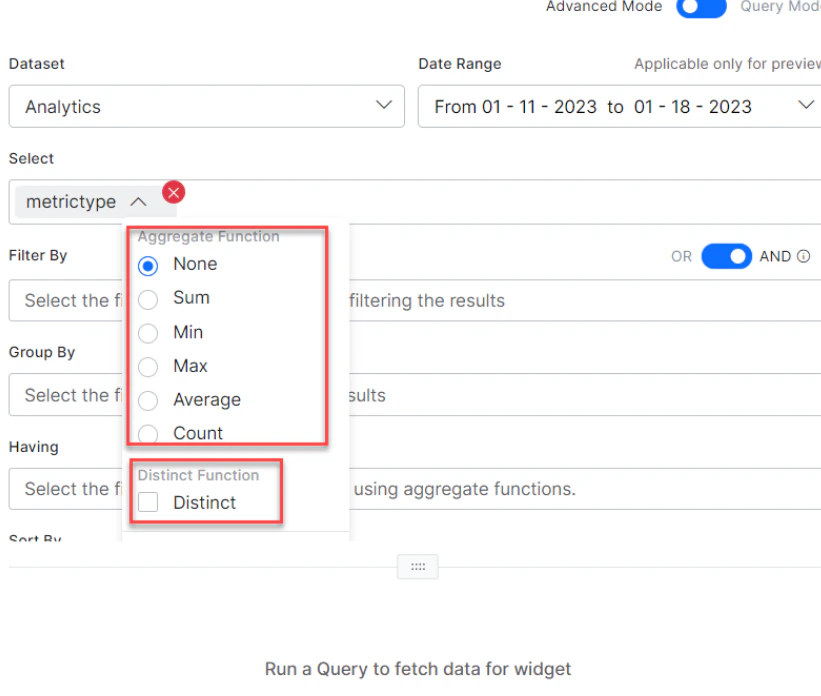
The Distinct function obtains the number of distinct values across the column. It’s allowed with Sum, Count, and Average.
If you have defined Custom or Meta Tags for your AI Agent, use them with the notation
userTag.tagname = value. For a Message-level custom tag, select the Message dataset and enter messageTag.TagName.
Filter By extracts only records that fulfill a specified condition. Supported operators: =, >=, <=, >, <, in, not in.
For example: taskName = 'What account privileges does an authorized user have?' and metricType = successtasks
When conjugating multiple conditions, they’re evaluated left to right. This ordering can’t be changed using parentheses.
In the query setup for Filter By, individual AND and OR operators, and multiple ANDs or ORs, can be applied. A combination of AND/ORs isn’t supported.
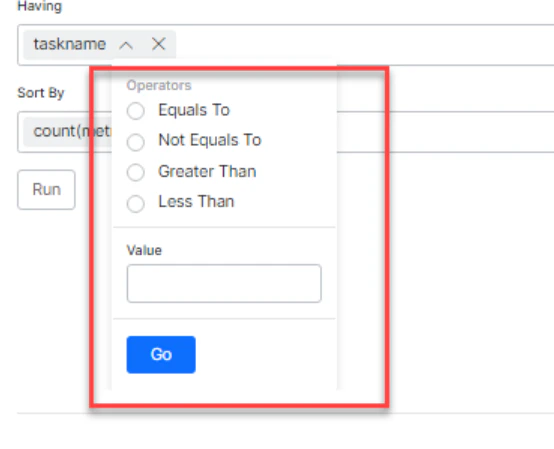
Where keyword can’t be used here). For example, count(messageid) > 10. Works only with the Group By function.
In the Having clause, fields with aggregate values in the Select clause are automatically included.
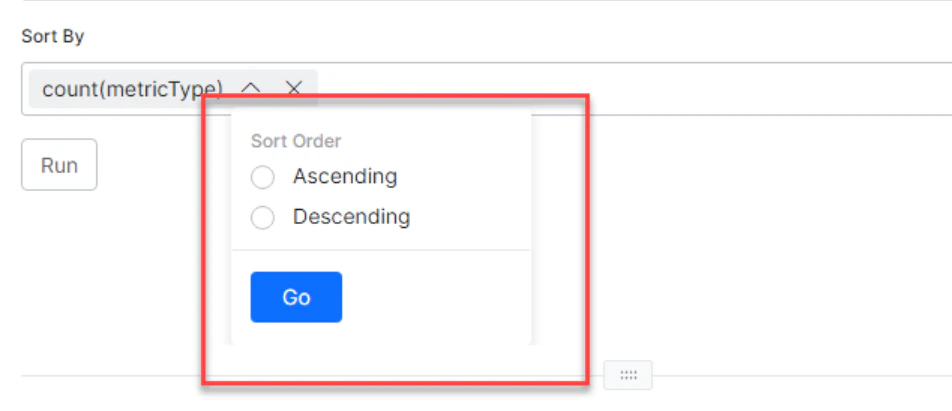
metricType desc.
In the Select clause, you can provide aliases to make column names more readable. For other fields, you can’t define aliases and must use actual column names.
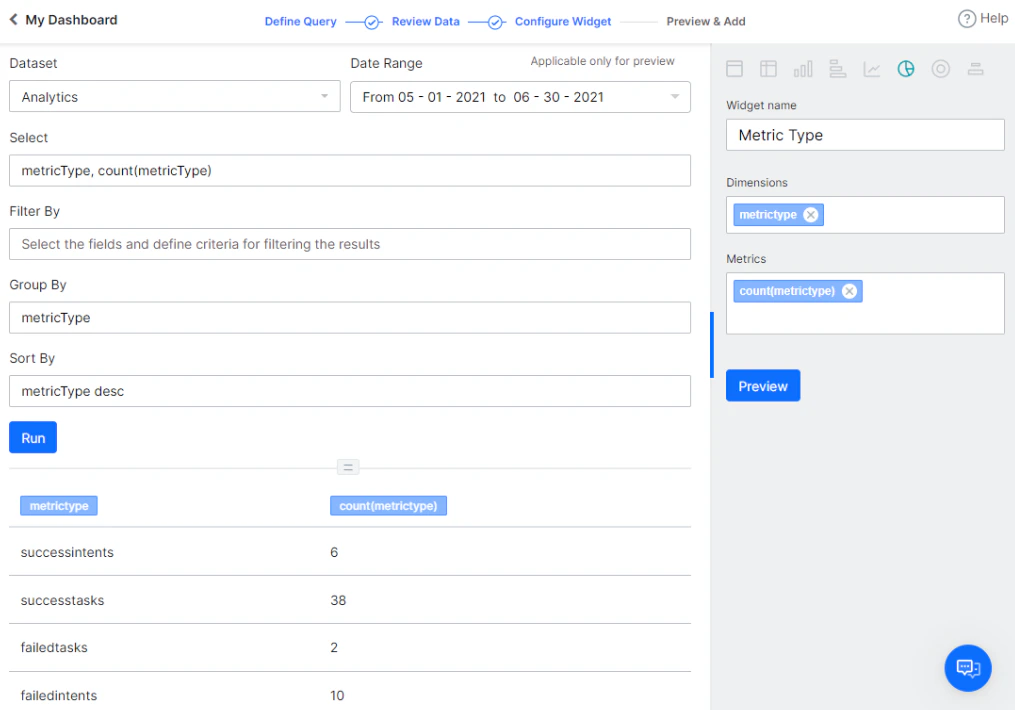
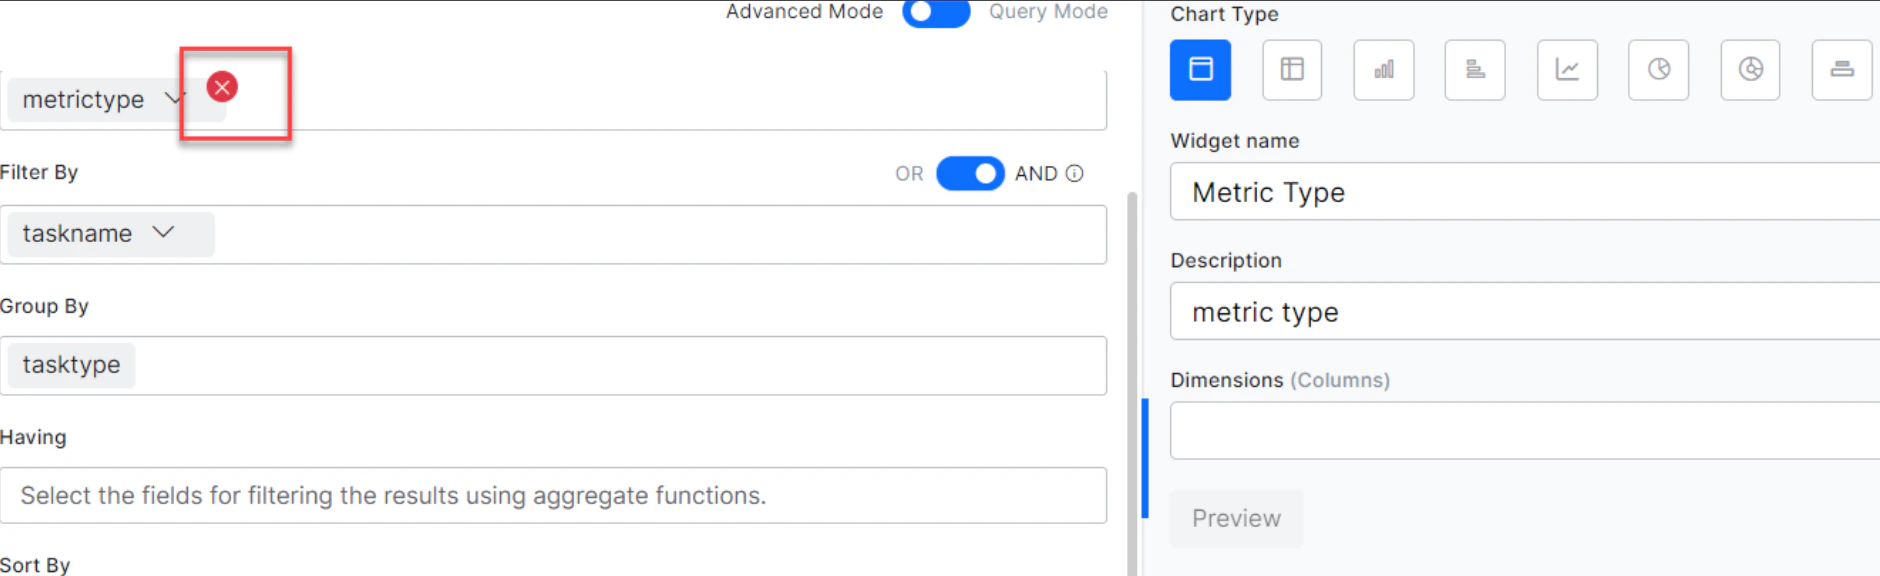
A tag added for Select, Filter By, Group By, Having, and so on can be deleted using the Delete icon, which appears on hover.
End-user vs. Developer Interactions
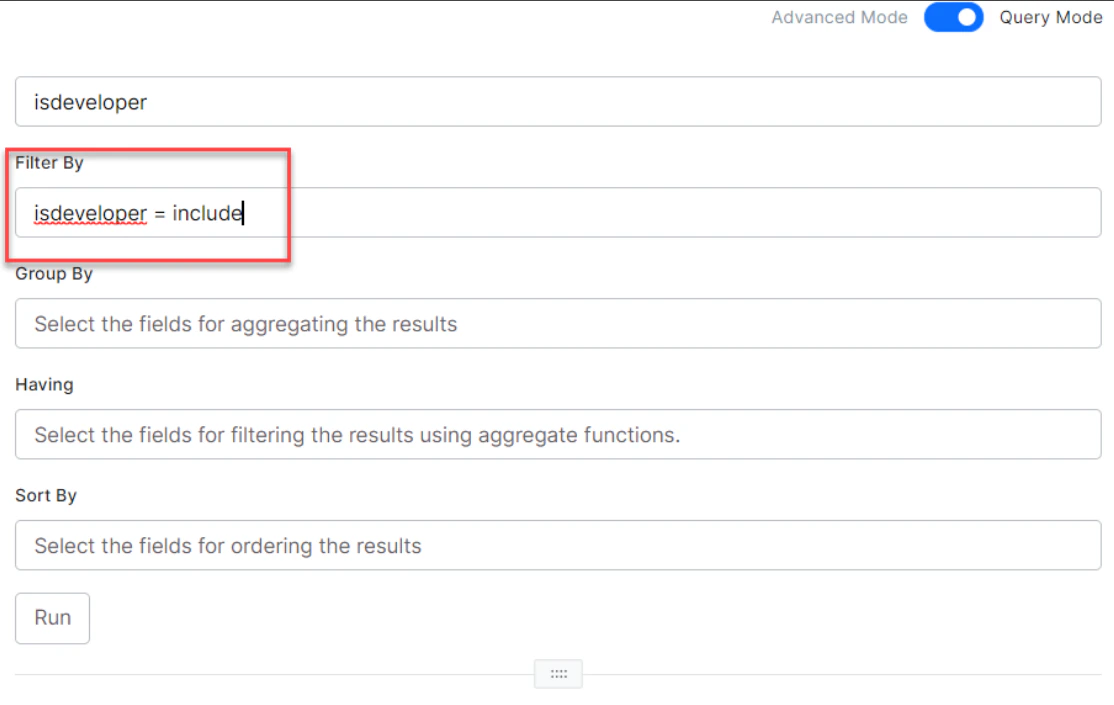
By default, end-user interactions are displayed for all datasets in Custom Dashboards. To include or display developer interactions, use theisdeveloper flag in the Filter By clause:
- To display only developer interactions:
isdeveloper = include - To display both developer and end-user interactions:
isdeveloper = include or isdeveloper = excludeisdeveloper = exclude or sessionid = "any developer session Id"
Data Representation
The following options are available for rendering data:- Table: Renders data in a simple row and column format. Specify columns and their order from the Dimensions option.
- Pivot chart: Summarizes data. Specify Dimensions (columns to display), Metrics (value against the column), and Overlay (column for data series representation).
- Bar Chart: Depicts data across X- and Y-axis. Split results into data series based on the Overlay field.
- Horizontal Bar Chart: A flipped version of the Bar Chart. Split results into data series based on the Overlay field.
- Line Chart: Depicts data across X- and Y-axis. Split results into data series based on the Overlay field.
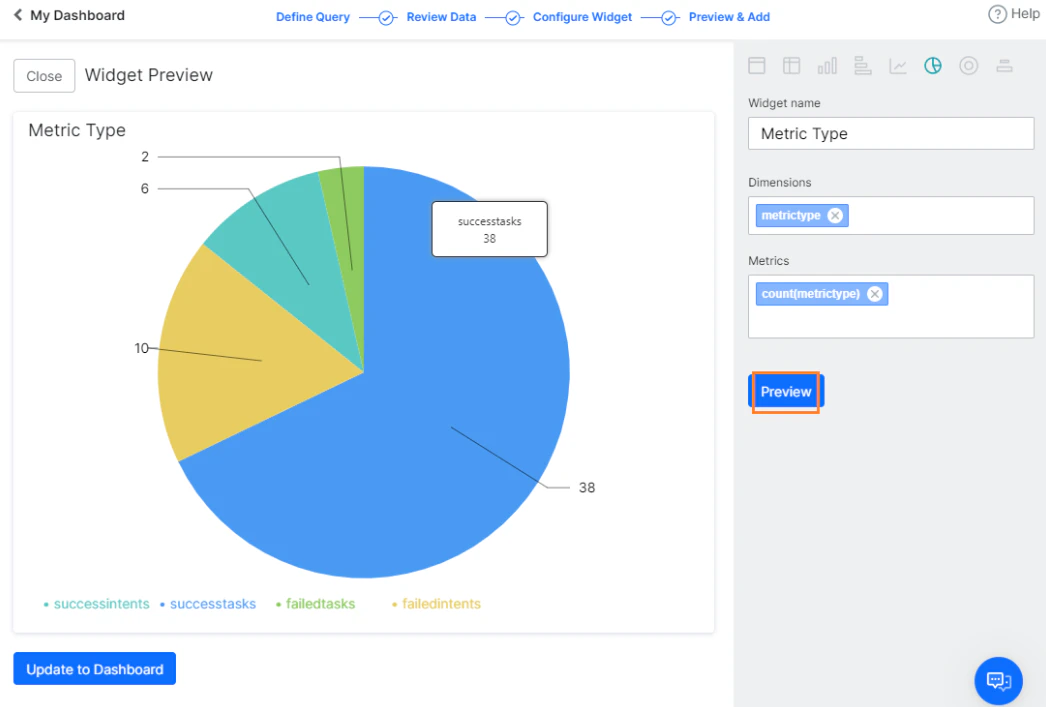
- Pie Chart: Used for aggregation data to depict part-of-whole scenarios. Use Dimensions for fields and Metrics for the aggregation function.
- Donut Chart: Similar to a Pie chart with better visualization.
- Label Chart: Highlights a value or metric in its own space.
You must successfully run the query before being able to preview it.
Widget Actions
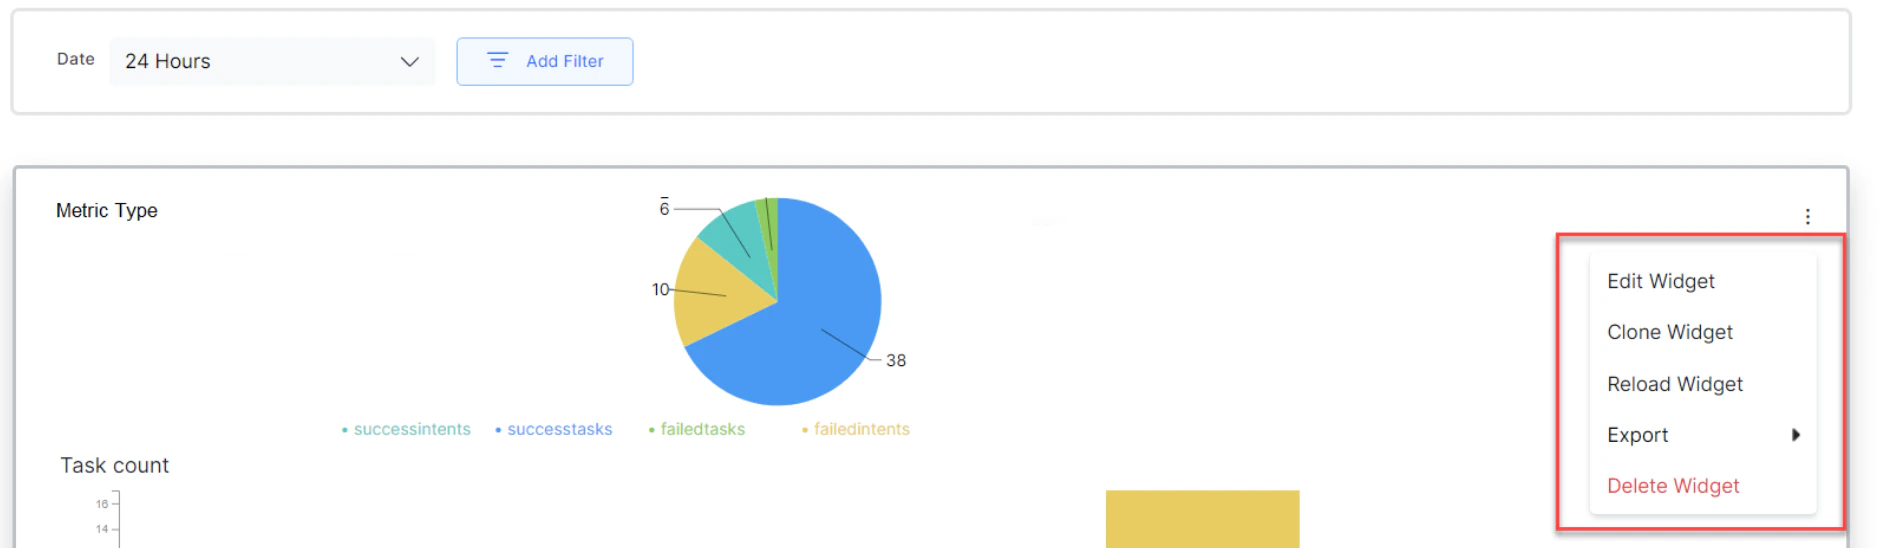
Use the more icon (vertical ellipses) on each widget to access the following options:- Edit Widget: Opens the widget definition page to make changes to an existing widget.
- Clone Widget: Duplicates the widget definition for modification.
- Export: Exports the widget data in JSON format (final results displayed in the widget UI) or CSV format (results of the associated query before conversion to widget UI format).
- Delete Widget: Deletes the widget from the dashboard.
The final widget definitions of a custom dashboard can be exported in JSON format. Individual widget data can be exported in CSV format.
Widget Configuration Modes
The platform provides two modes for extracting data from a selected dataset. These modes were introduced in the 10.0 release.Query Mode
Query Mode is for users and developers who can write queries to create a widget. This is recommended for advanced users who are familiar with the dataset fields.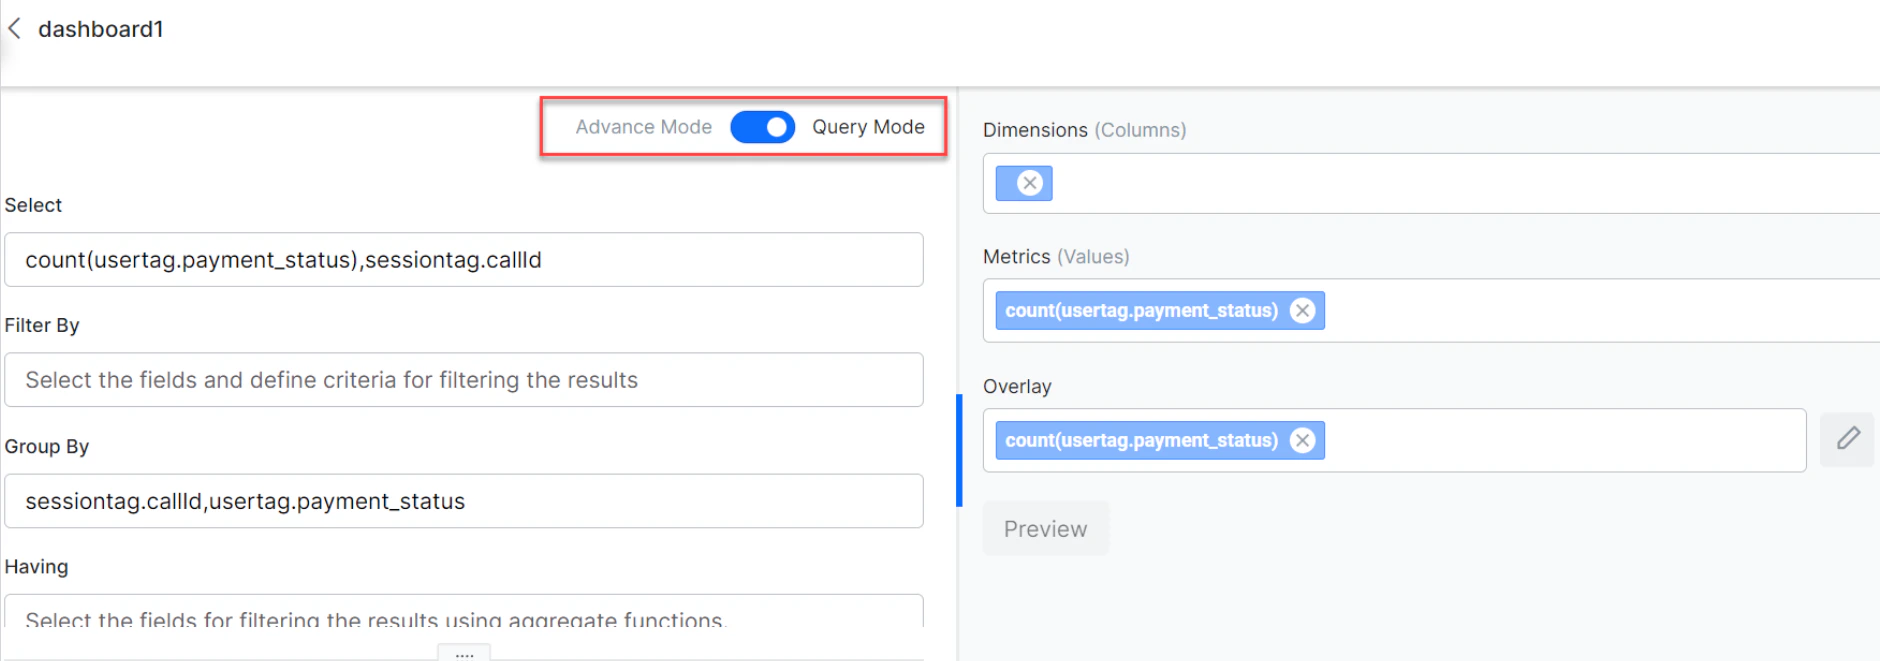
Advanced Mode
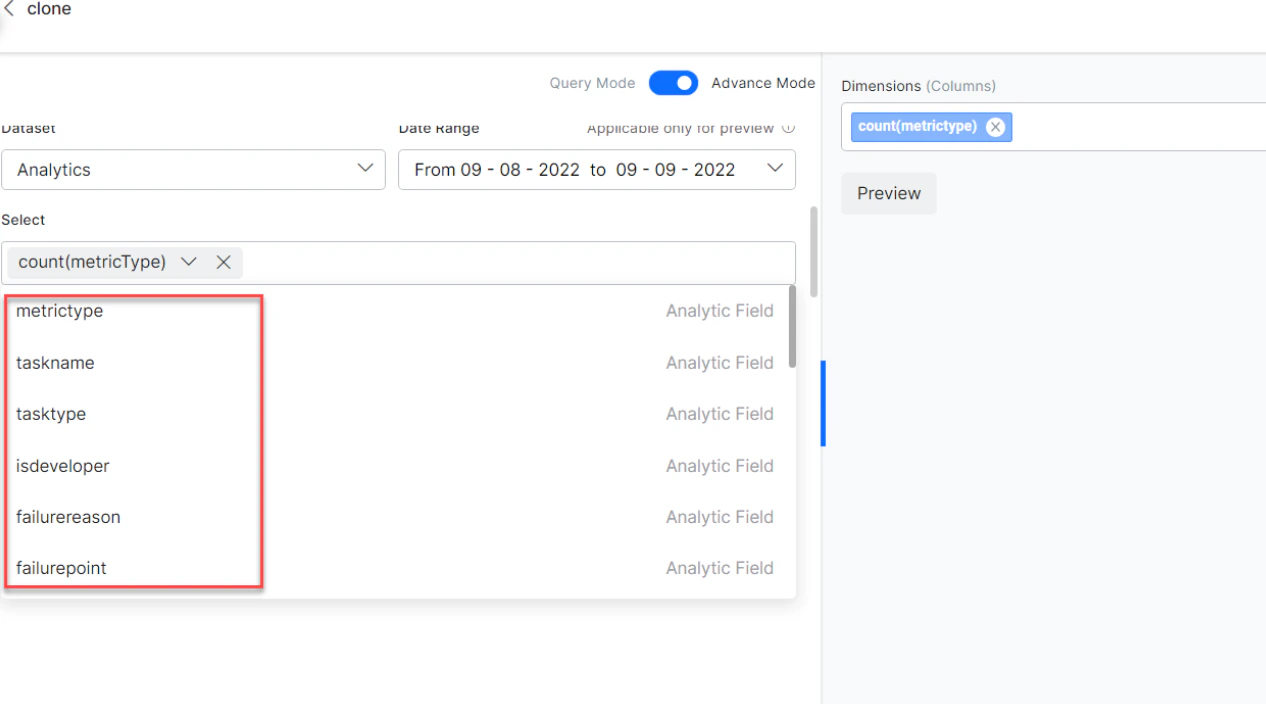
Advanced Mode provides a user-friendly way to create custom dashboards without requiring technical knowledge of query syntax or dataset structure. The platform provides type-ahead suggestions for fields, aggregate functions, and aliases while writing a query.The configured data remains intact when you toggle between Advanced and Query modes. You can modify widget configurations using either mode.
Type-Ahead Suggestions
In Advanced Mode, type-ahead suggestions are available for Select, Filter By, Group By, Having, and Sort By clauses. The platform provides suggestions of fields present in the selected dataset, along with message tags, session tags, and user tags added to the AI Agent. It also allows you to add aggregate functions, filter criteria, conditional operators, alias names, and more.You can add custom meta tags to the query that aren’t yet included in the AI Agent while configuring the widget. However, to get the correct data, you need to add the custom meta tag to the AI Agent configuration.
Custom Dashboard Limitations
- A maximum of 100 custom dashboards can be defined.
- Each dashboard can include a maximum of 100 widgets.
- A maximum of 3 metrics can be added to a chart.
- Each chart can render 1 dimension.
- The custom date range can be set for up to 90 days.
Dataset and Fields
The dataset fields and values are listed in the following tables.Field names are case-sensitive and must be used exactly as described here.